Century 21 People’s Choice Realty Inc., Brokerage
120 MATHESON BLVD E #103
MISSISSAUGA, Ontario
L4Z 1X1


Niagara Falls, Hospital, L2G 5J1
$549,900
Listed by RE/MAX Escarpment Realty Inc..
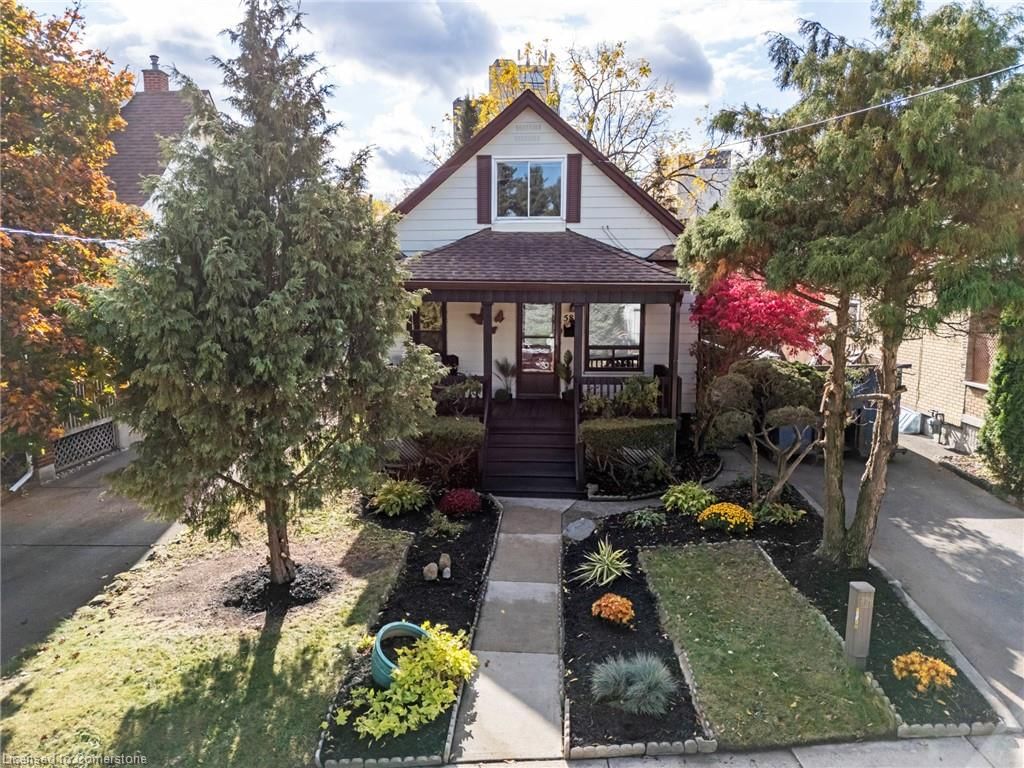
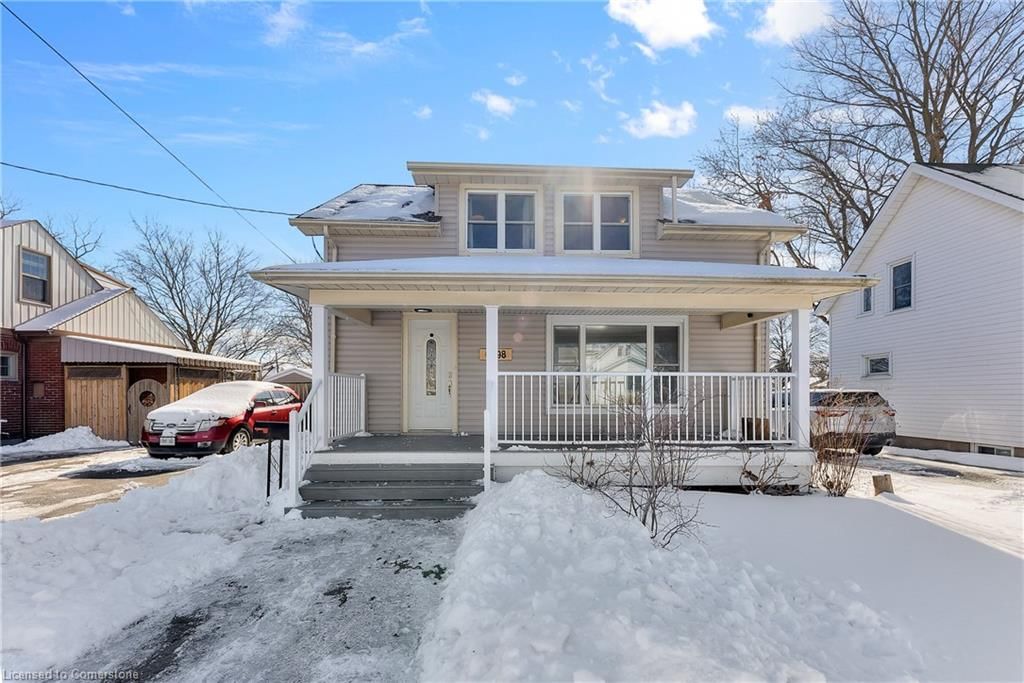
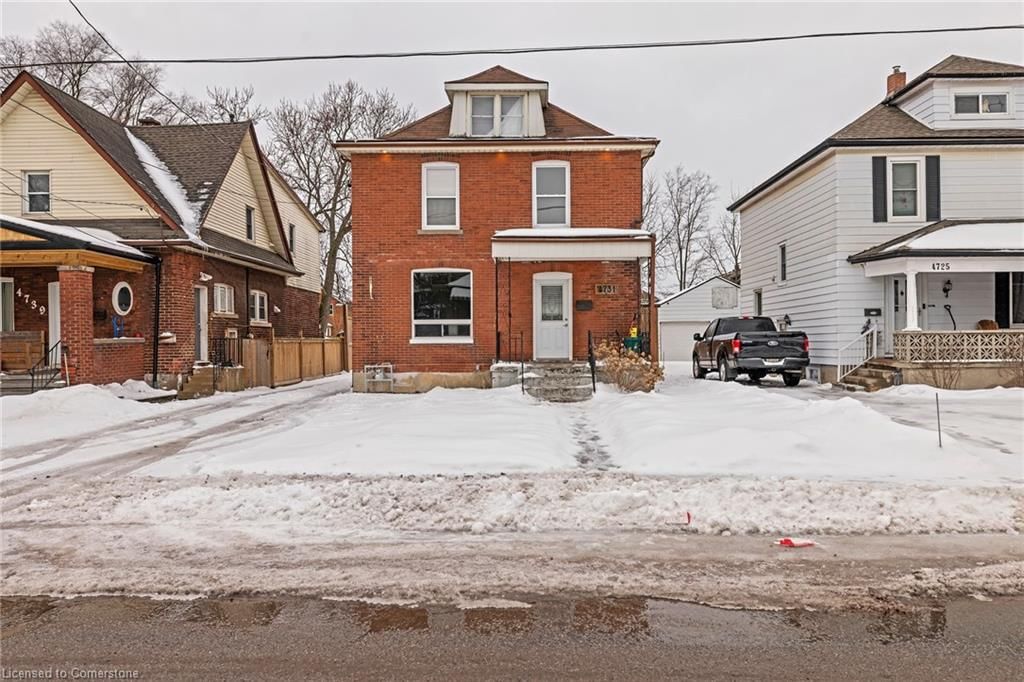
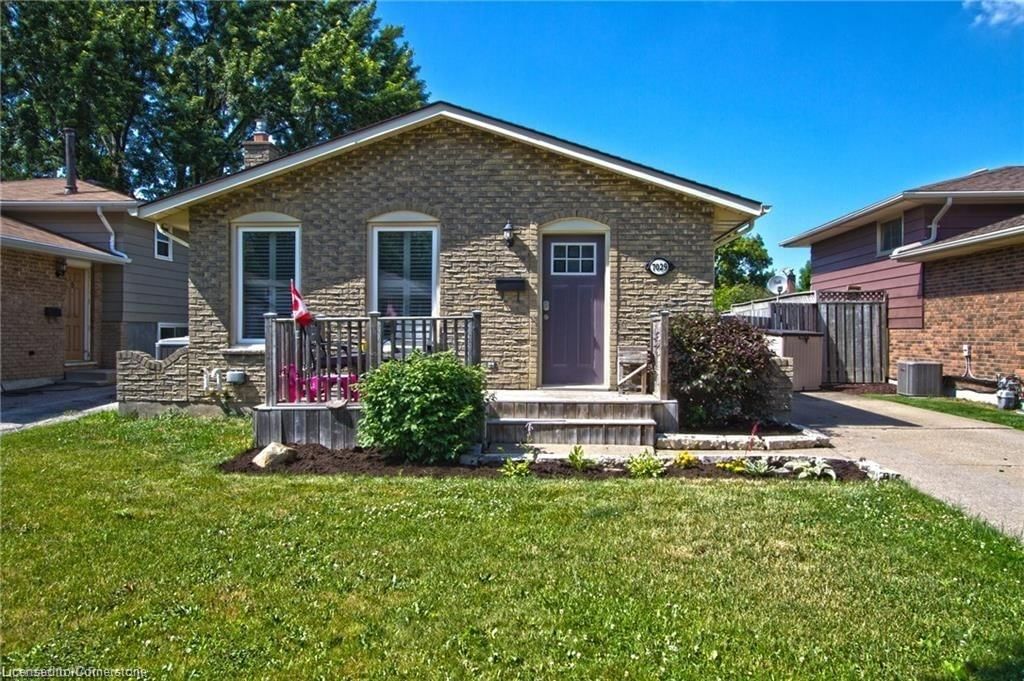
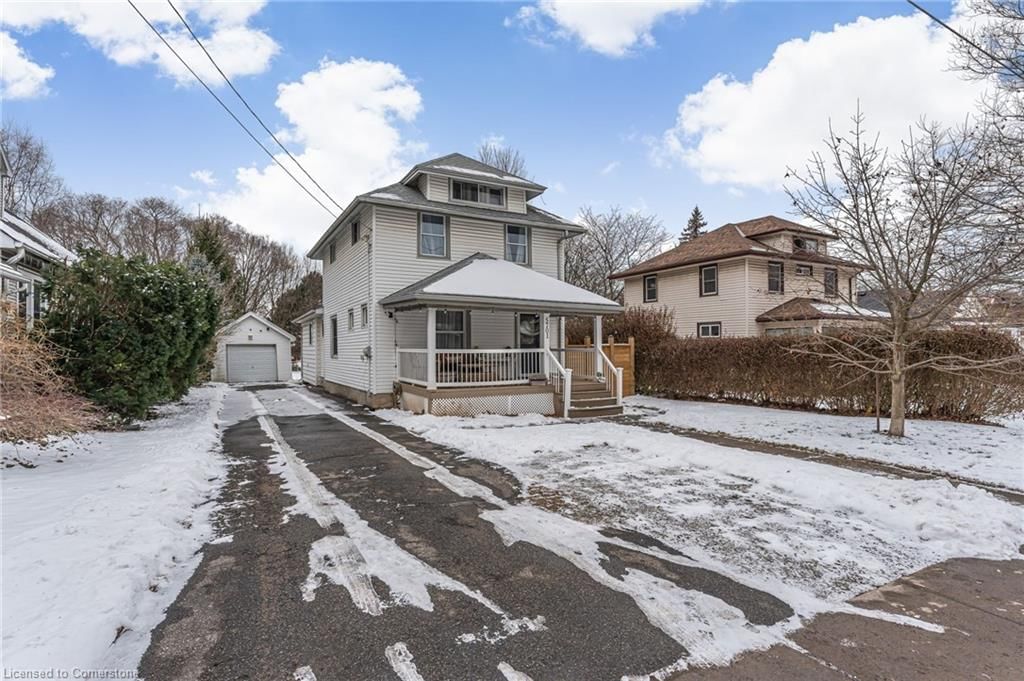
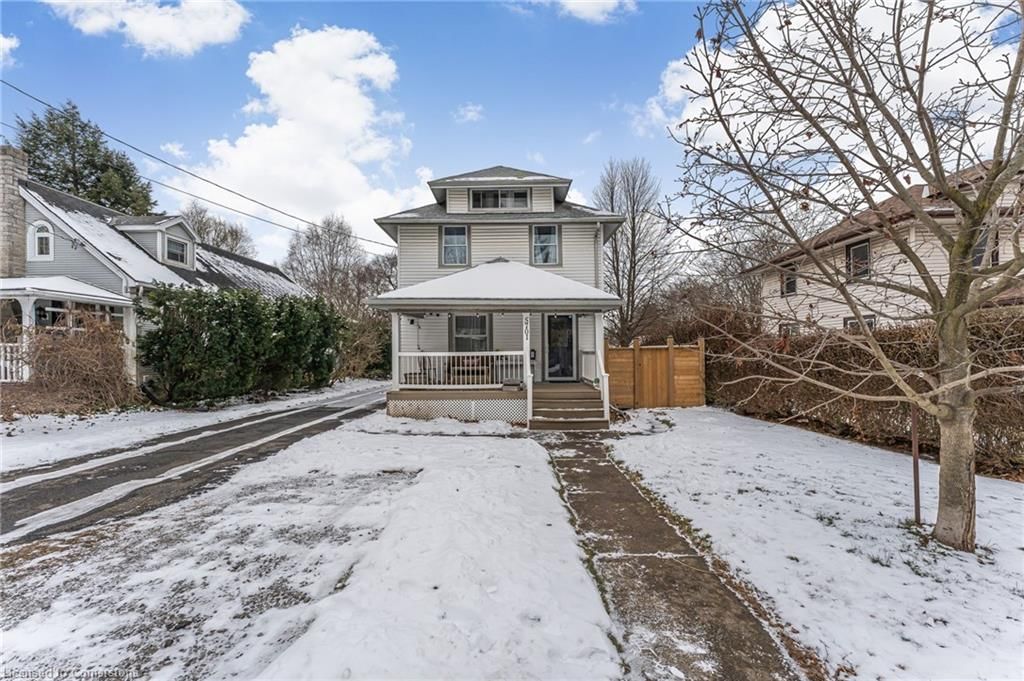
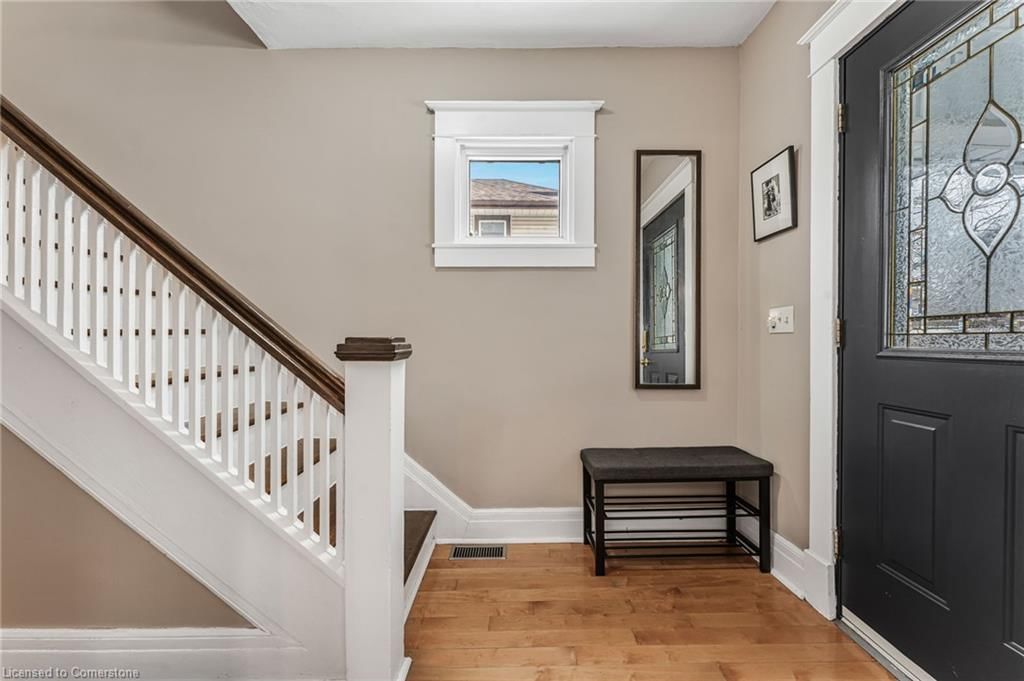
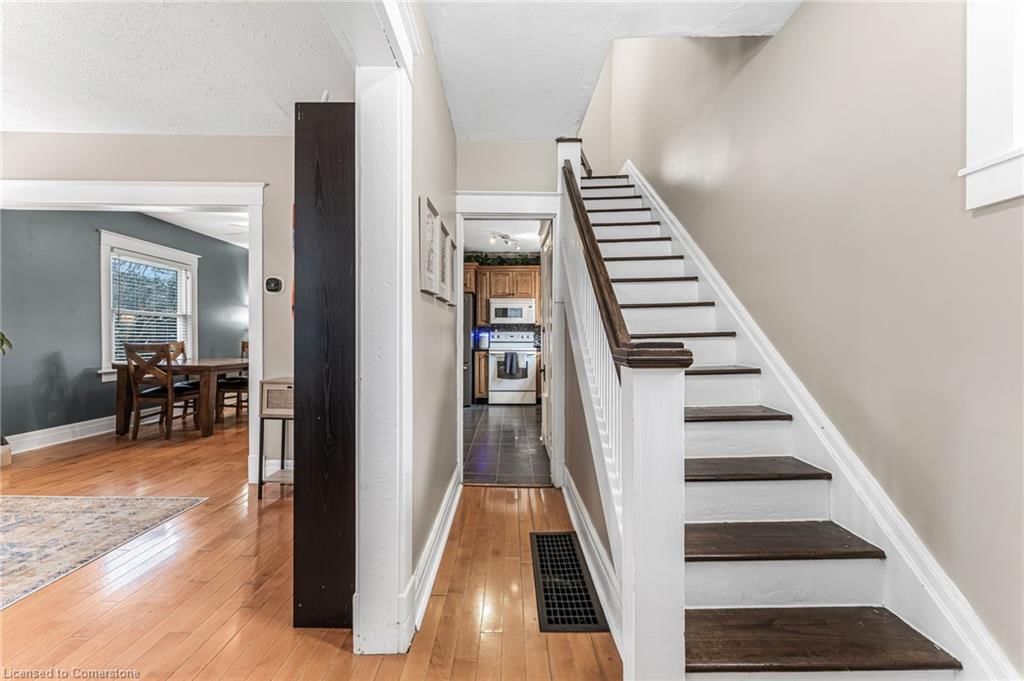
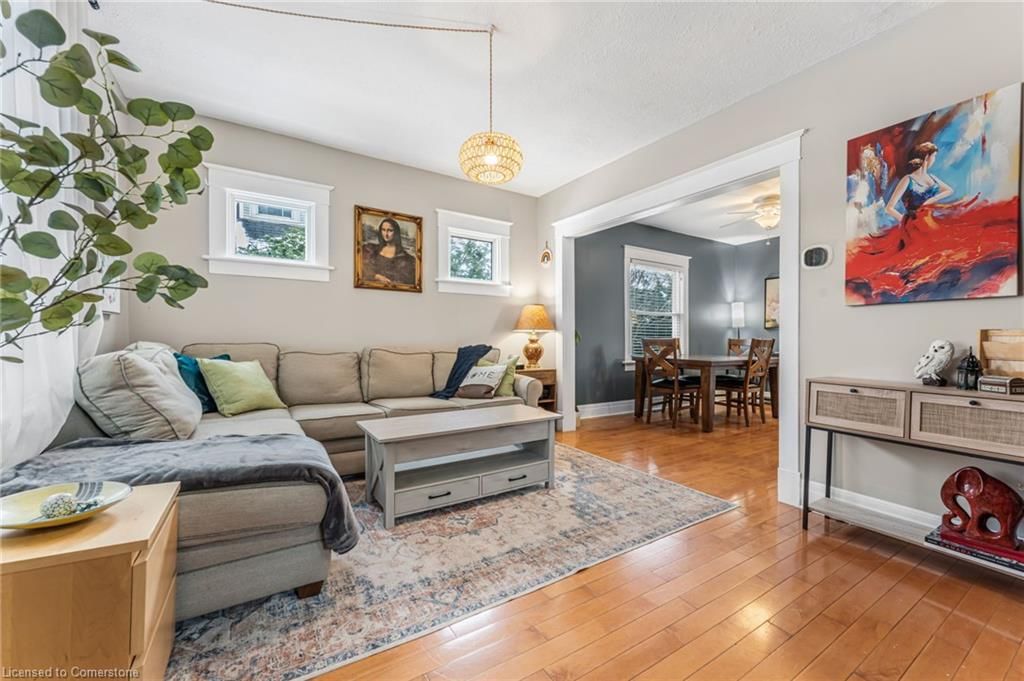
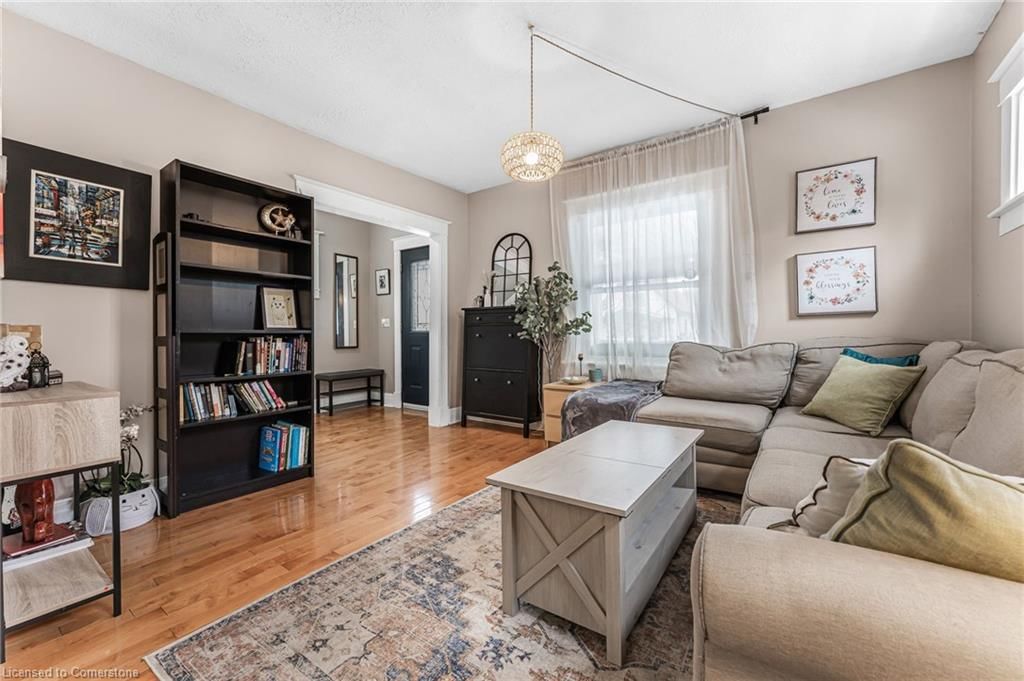
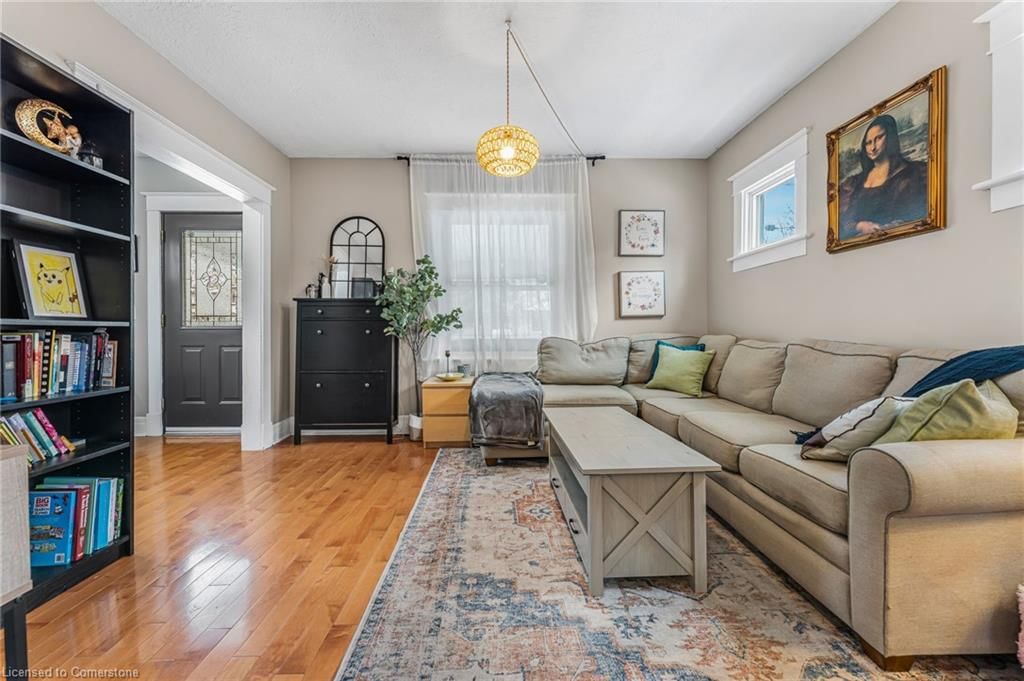
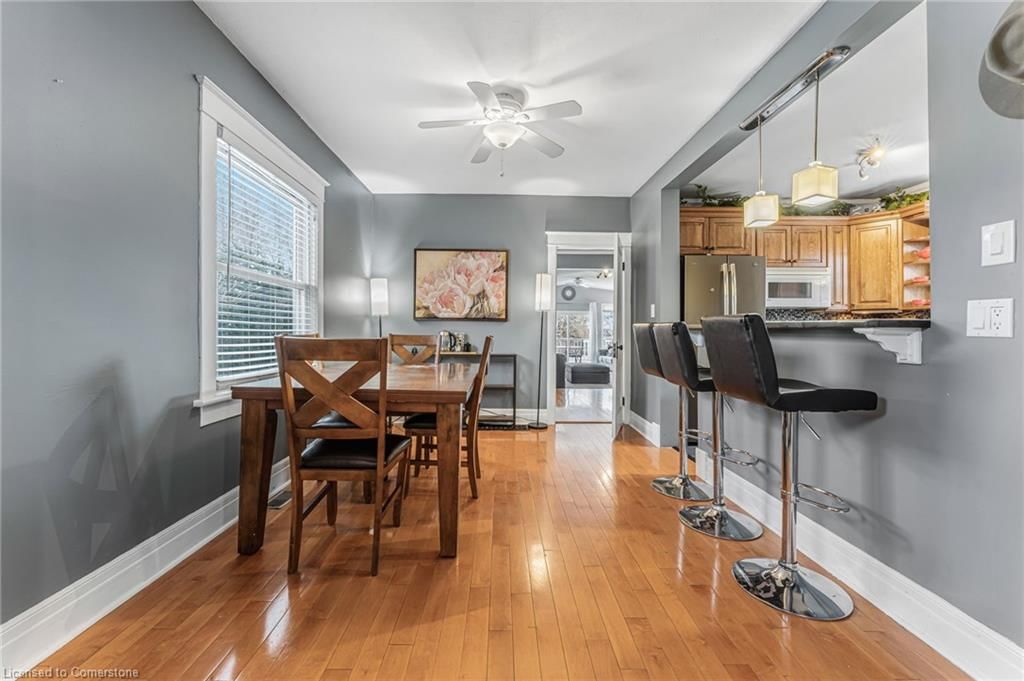
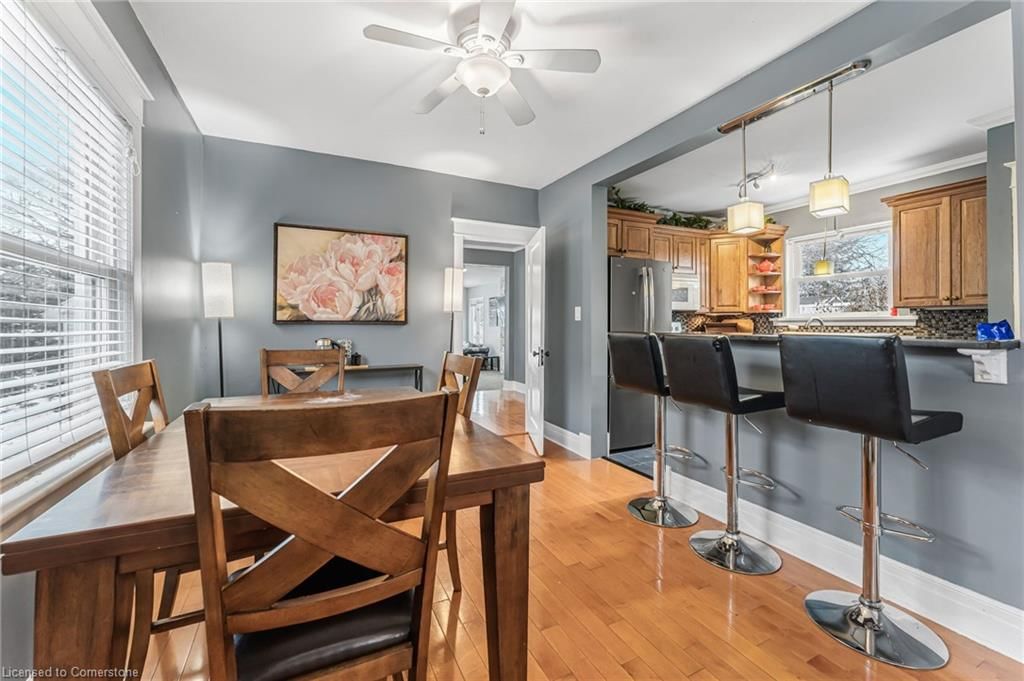
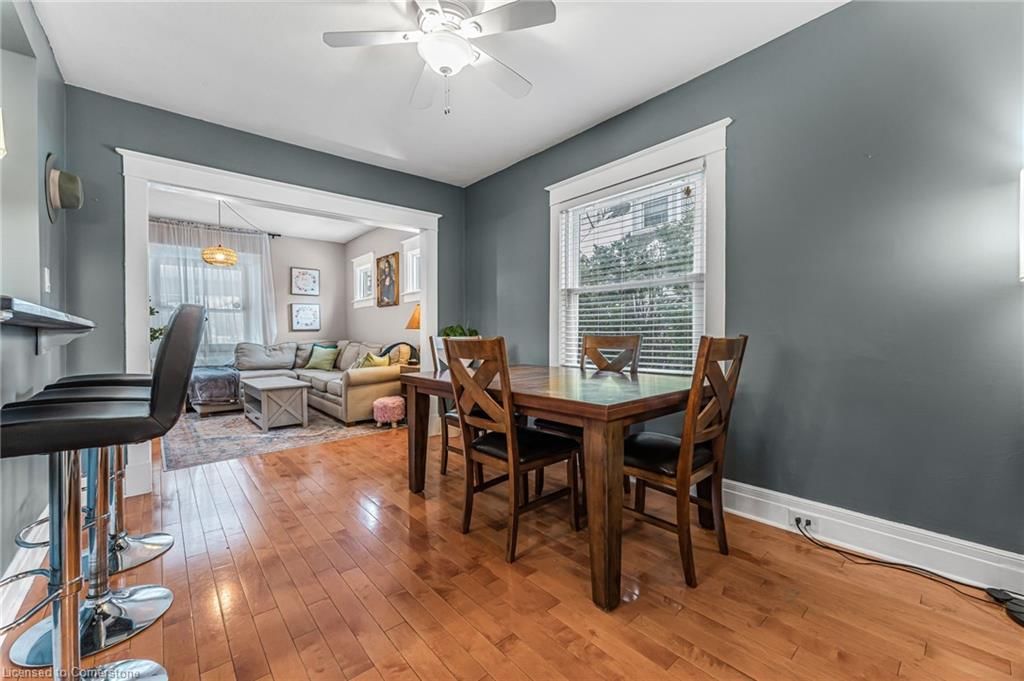
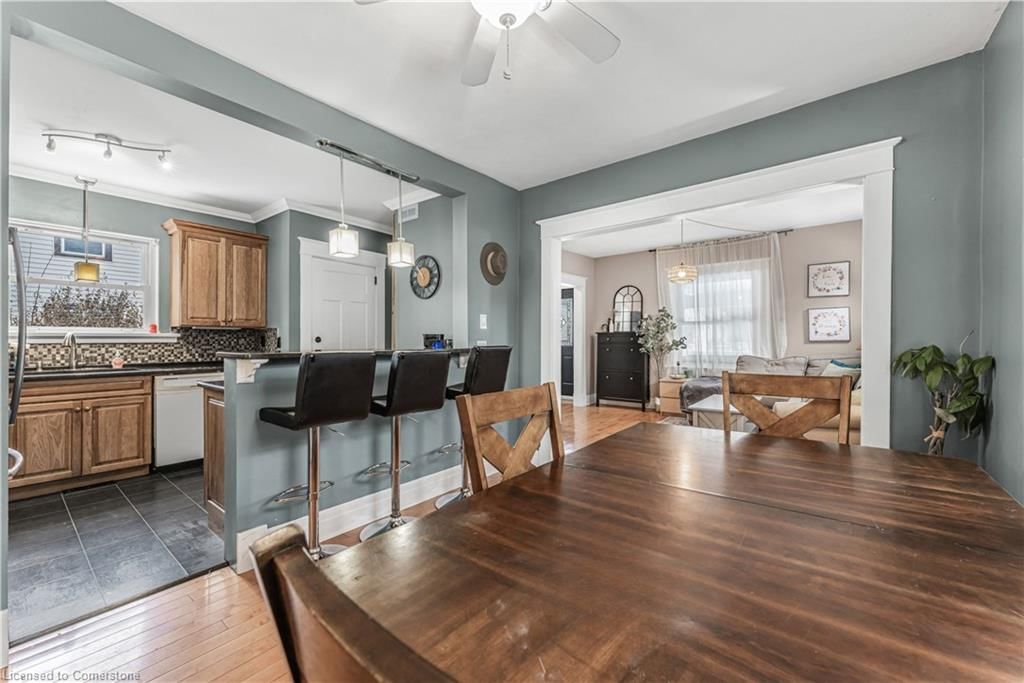
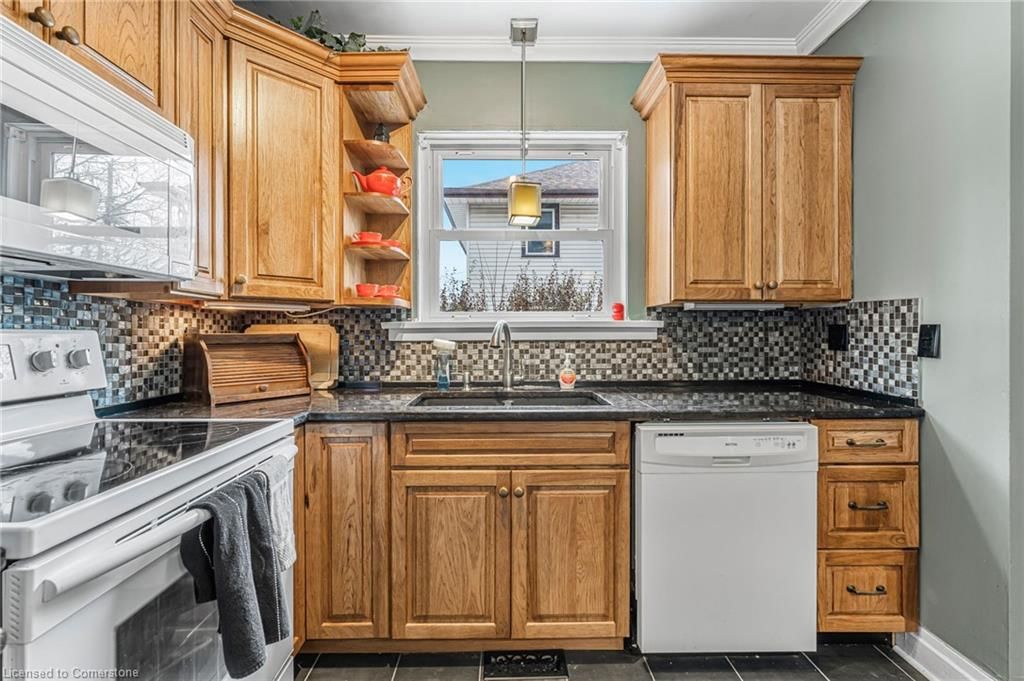
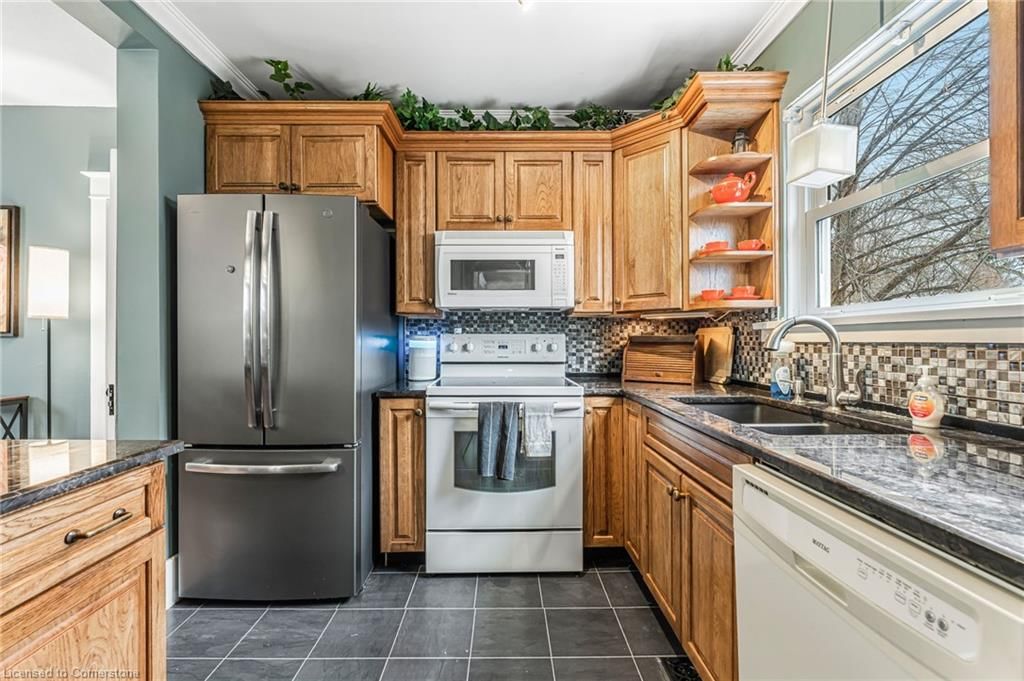
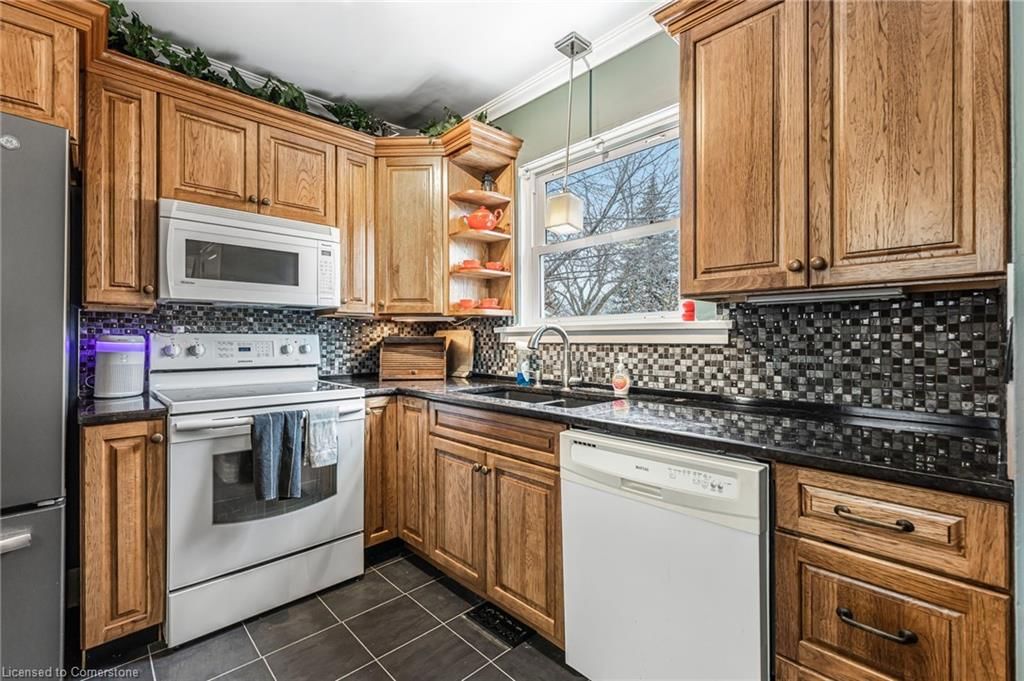
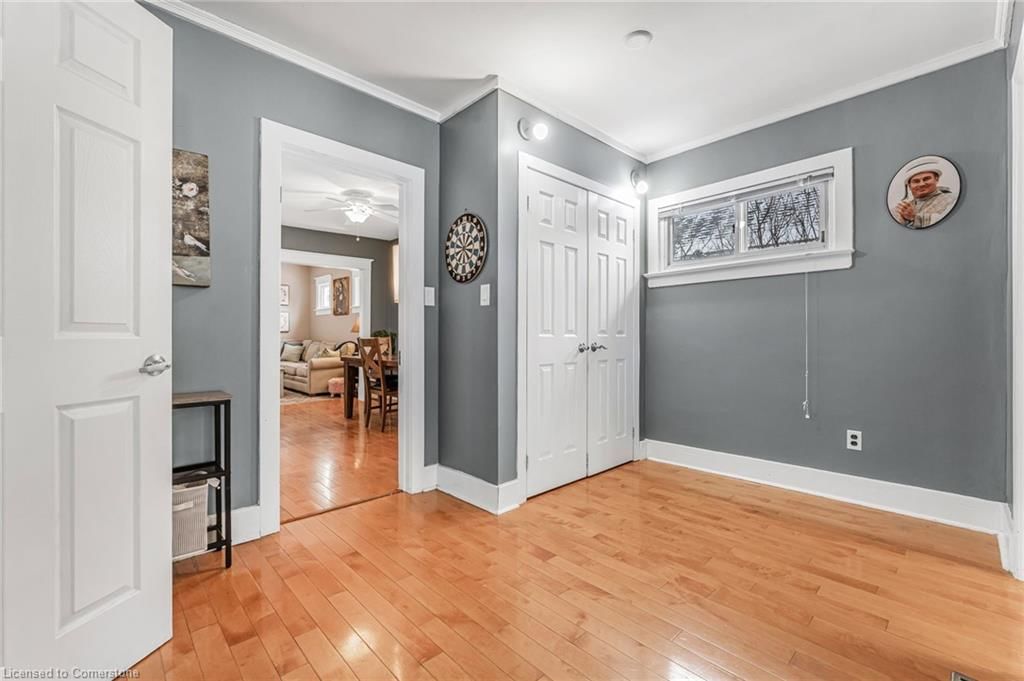
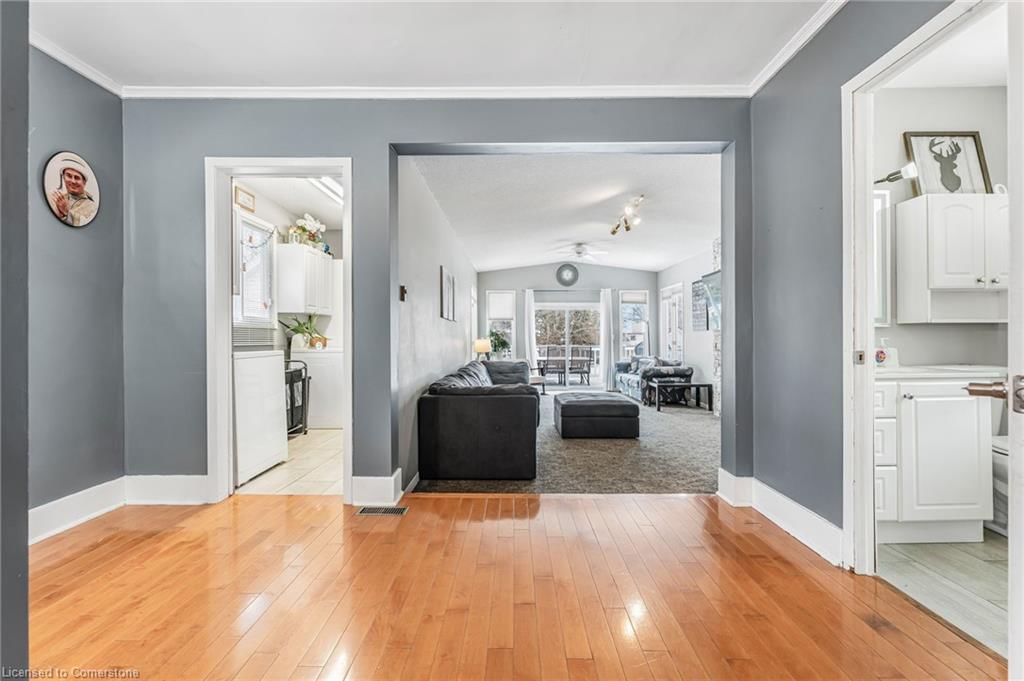
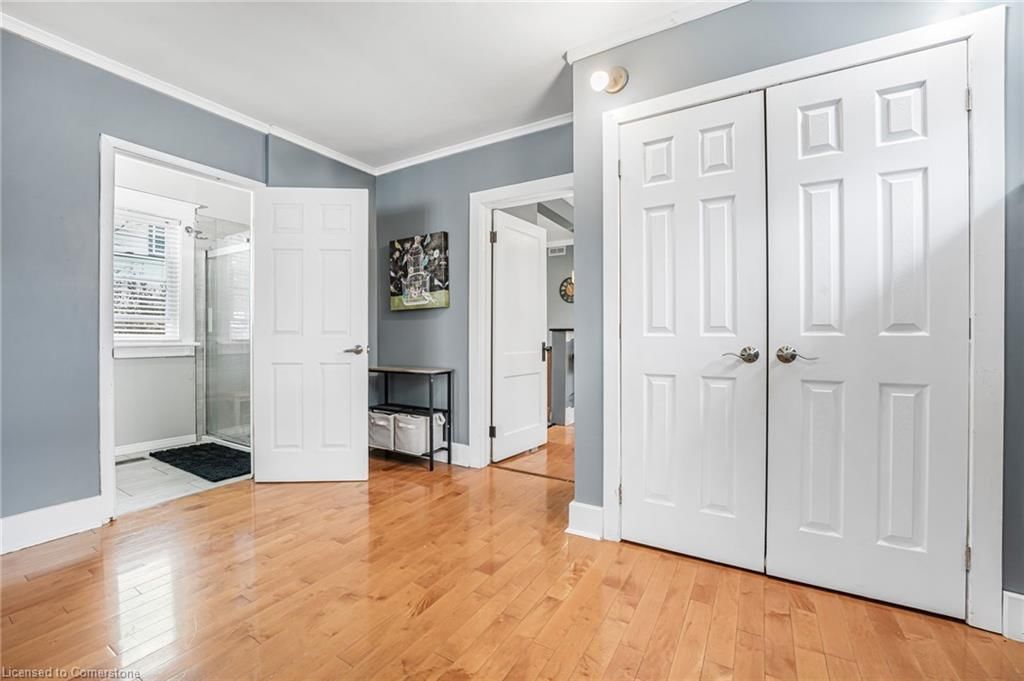
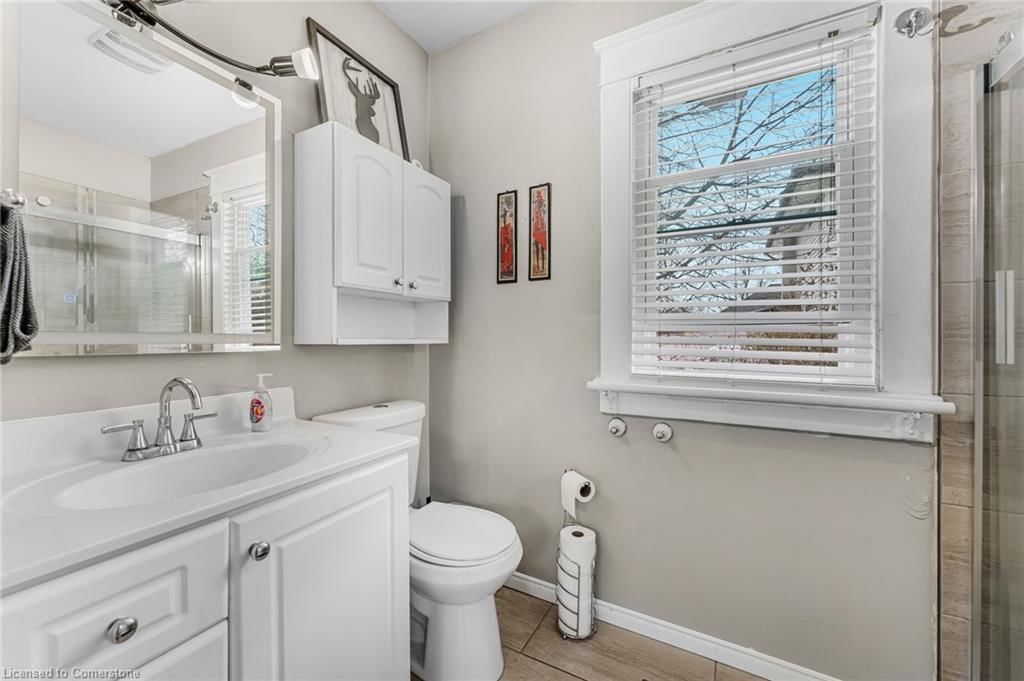
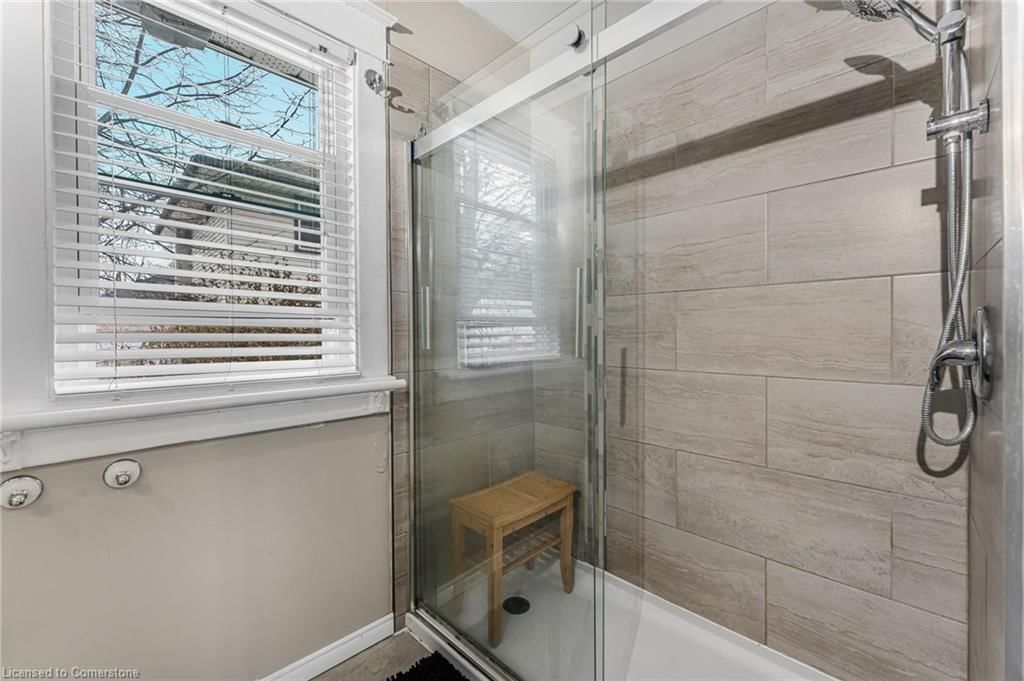
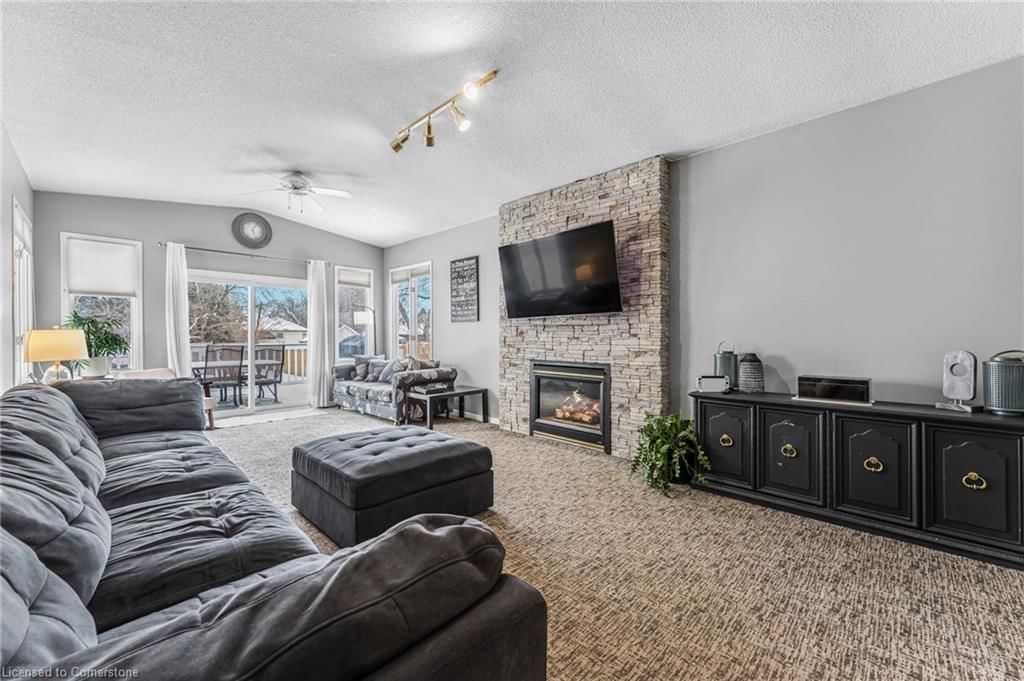
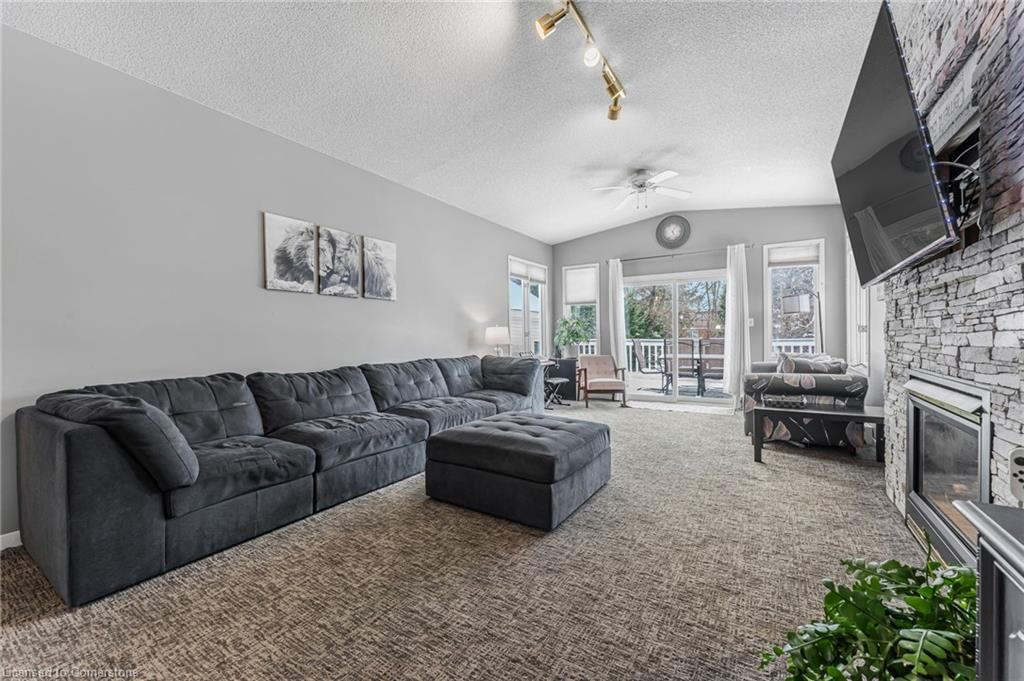
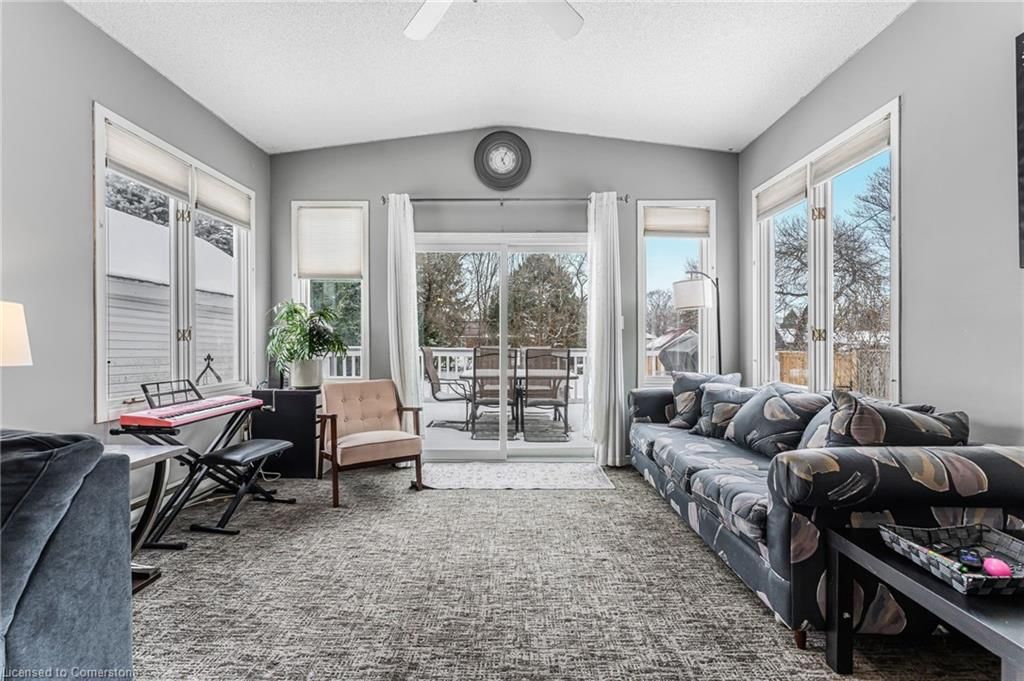
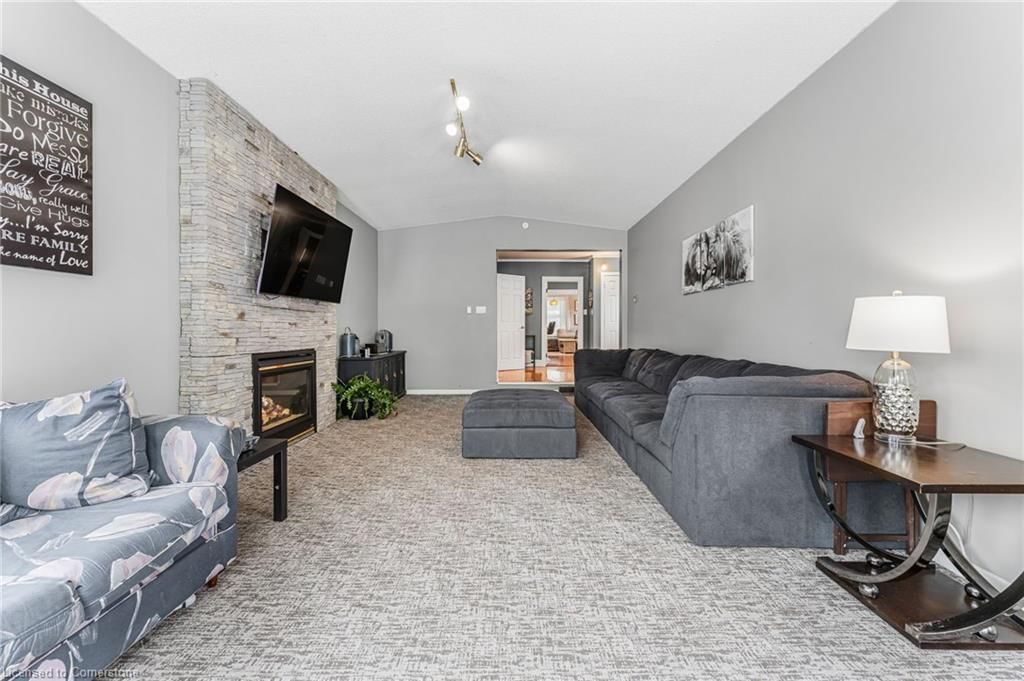
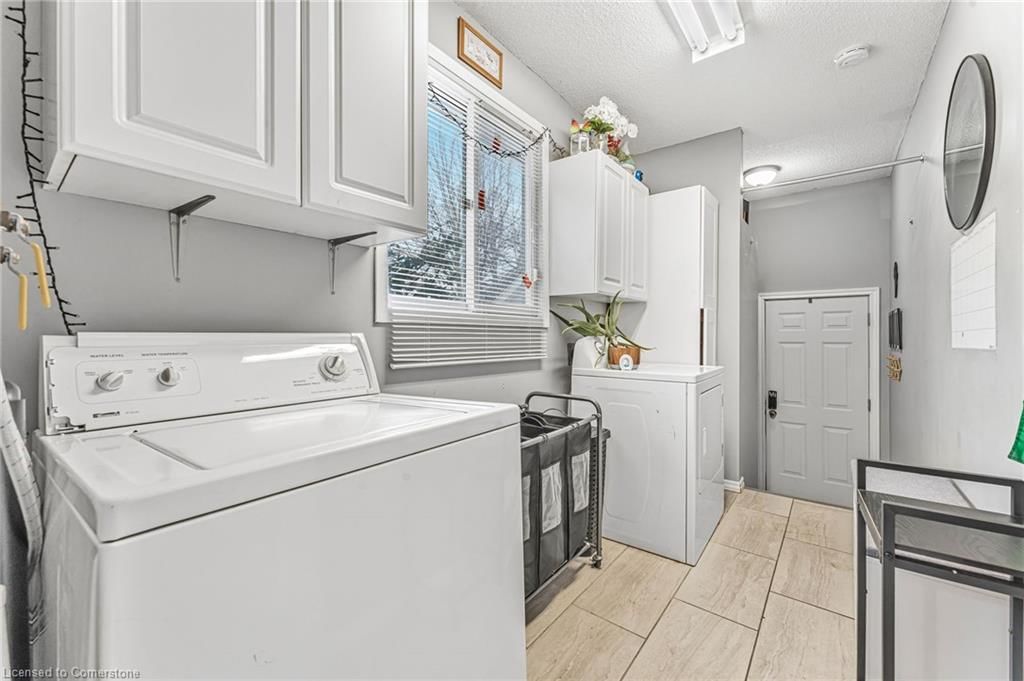
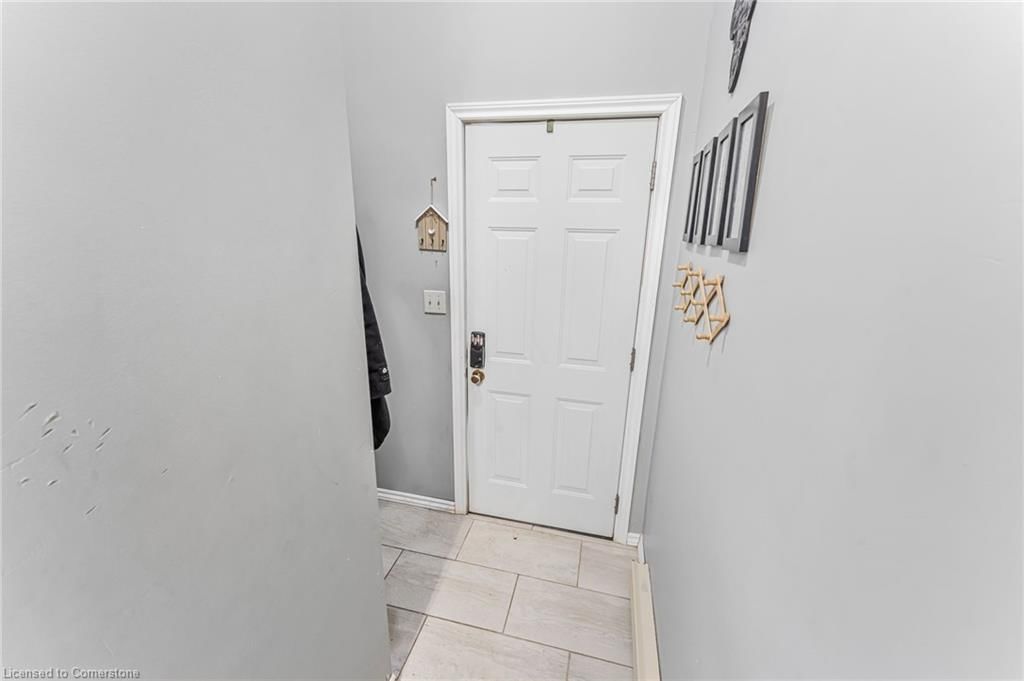
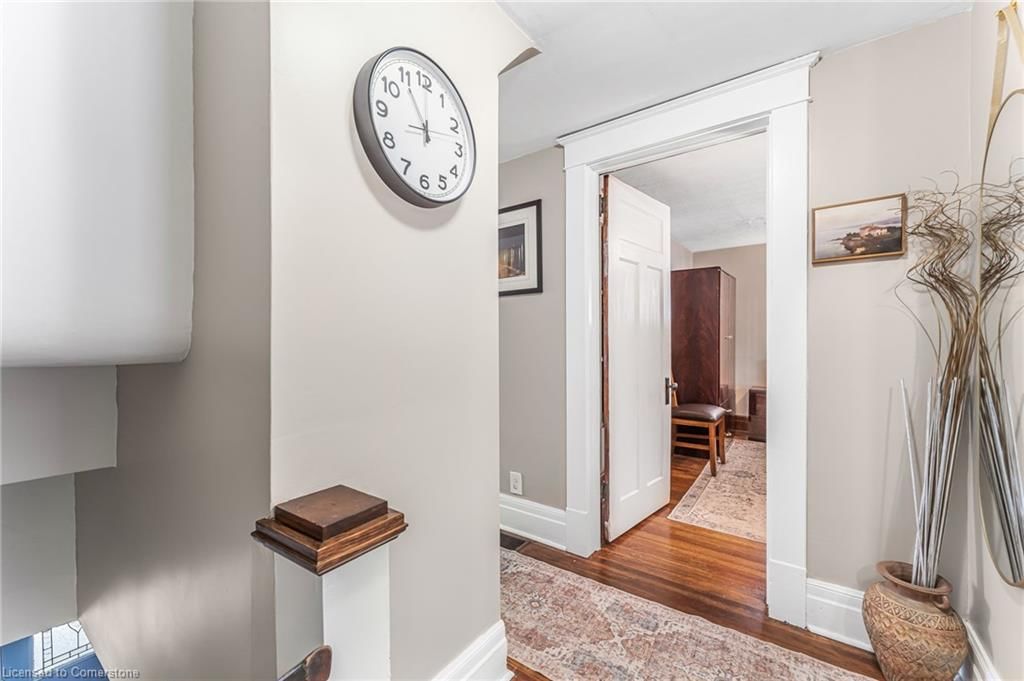
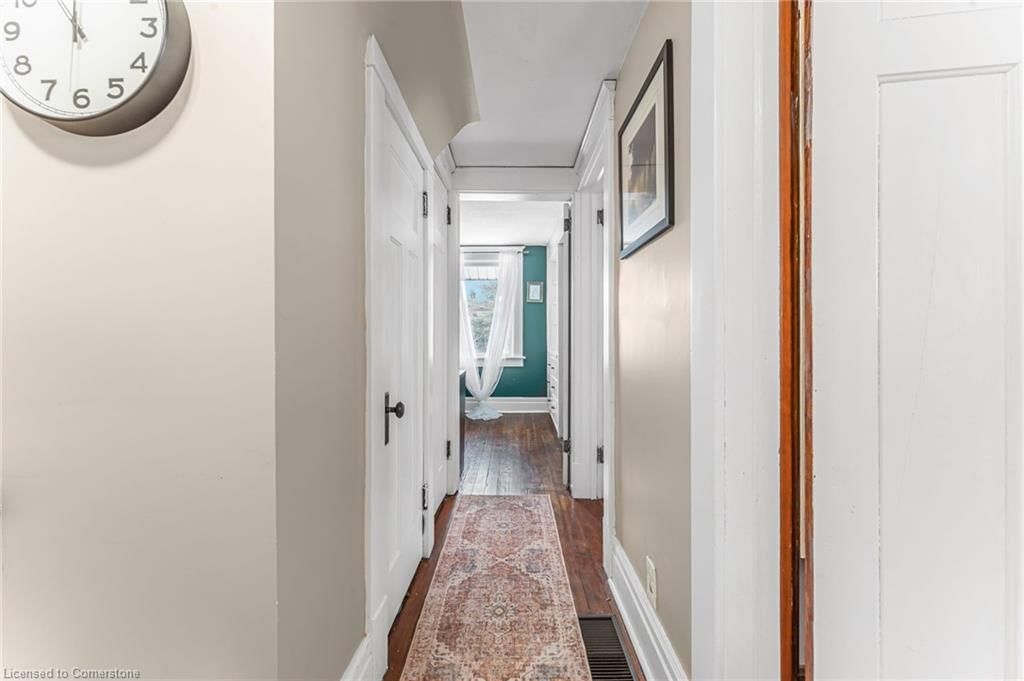
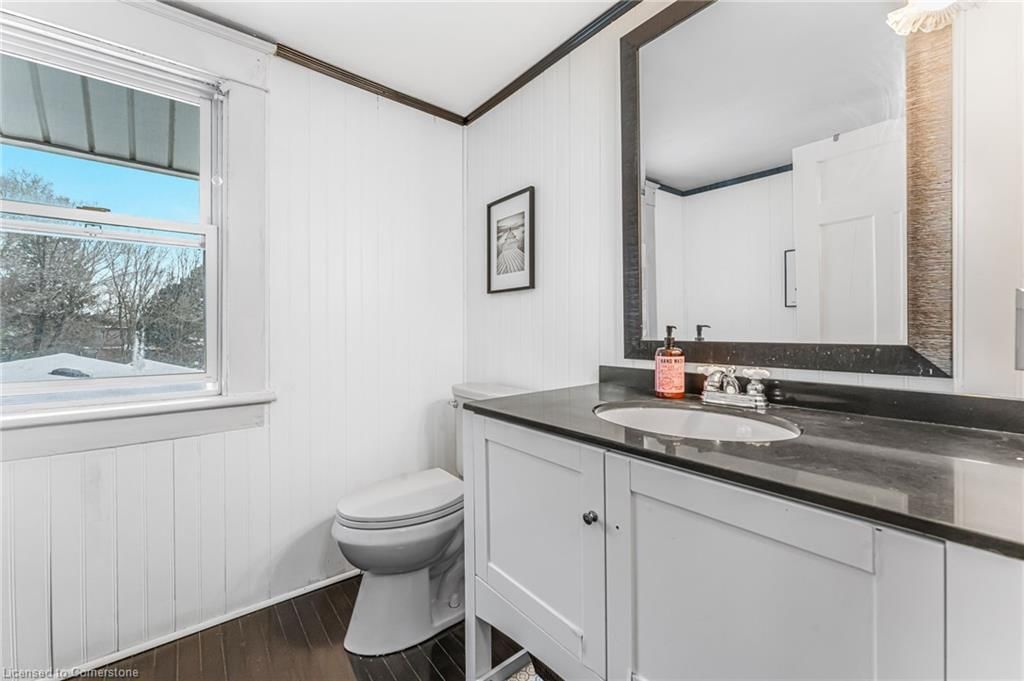
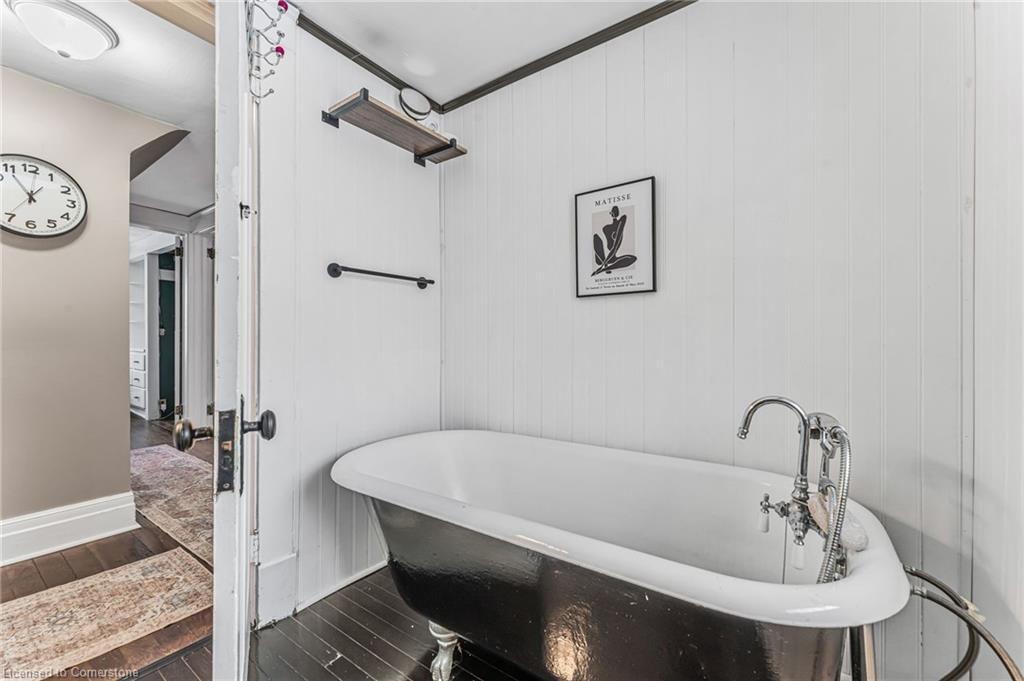
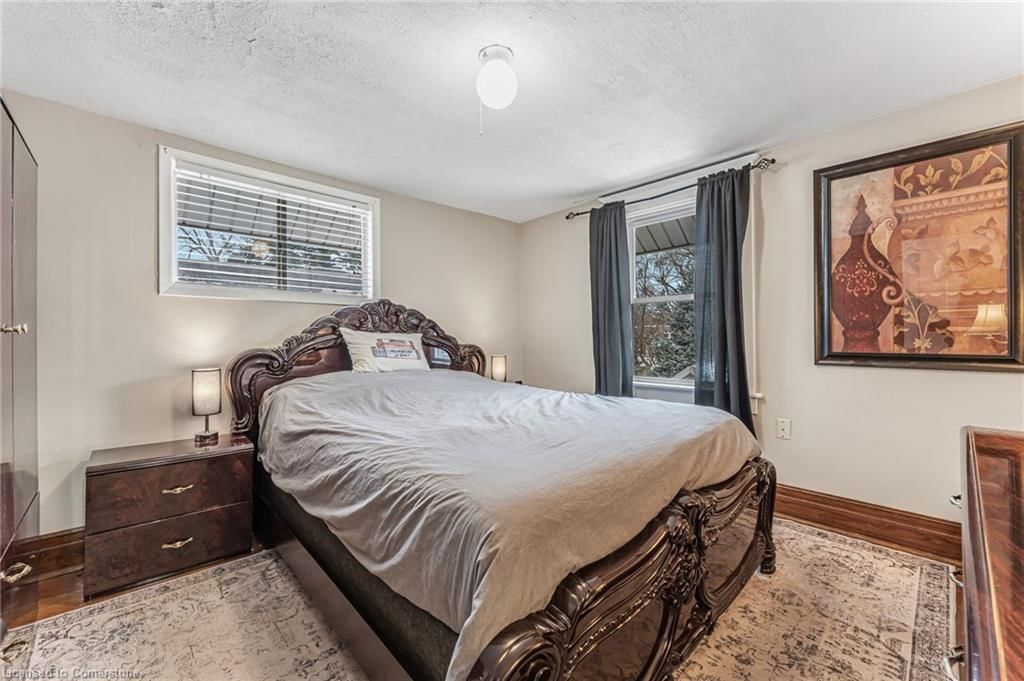
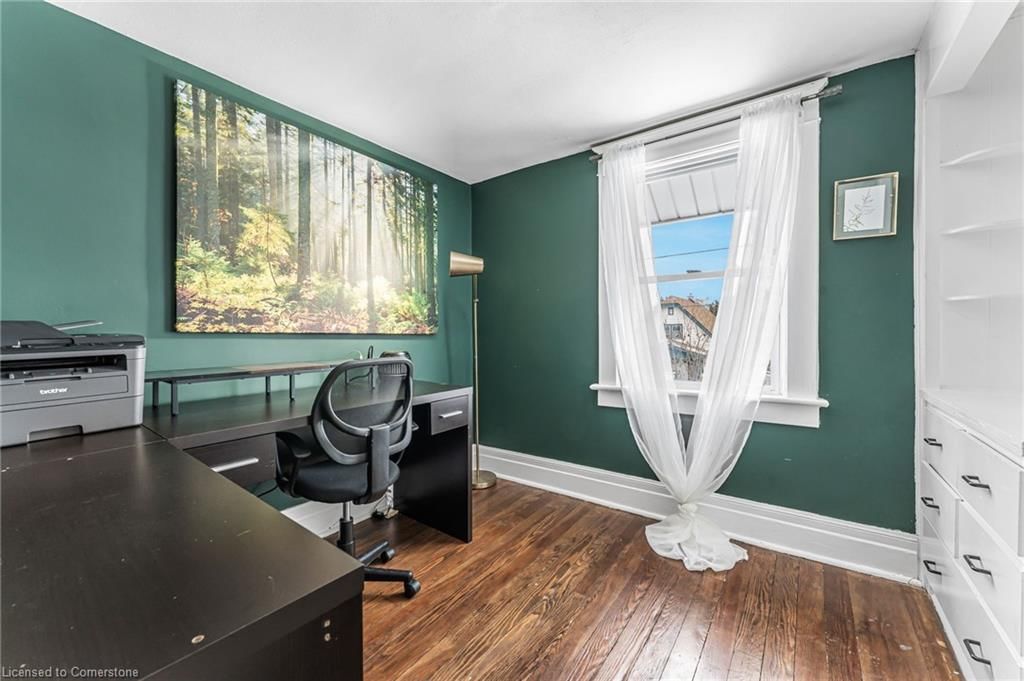
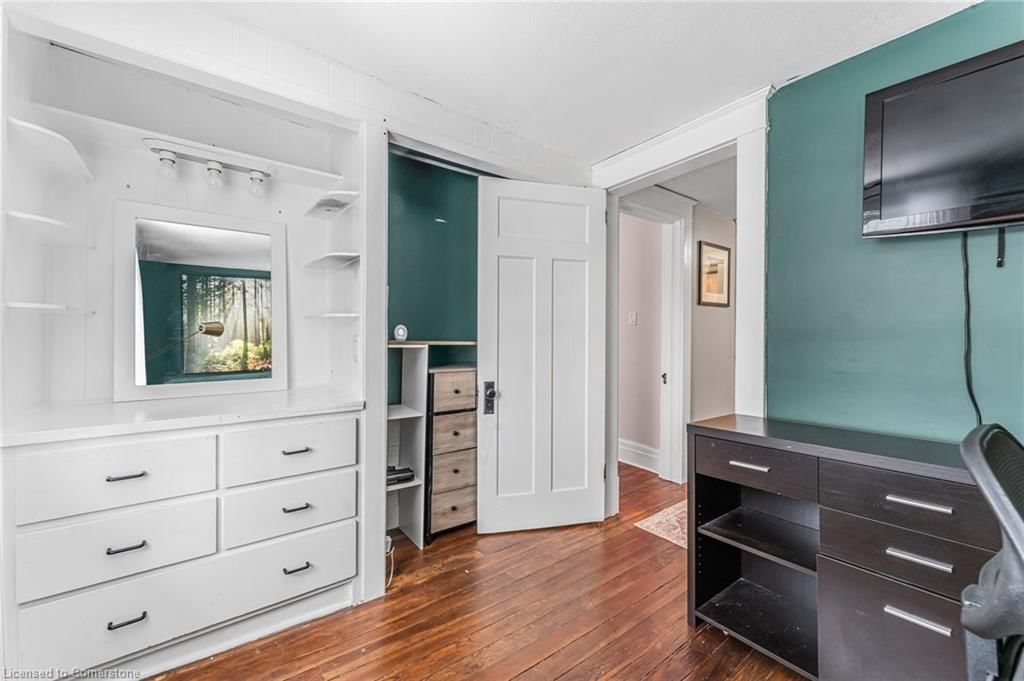
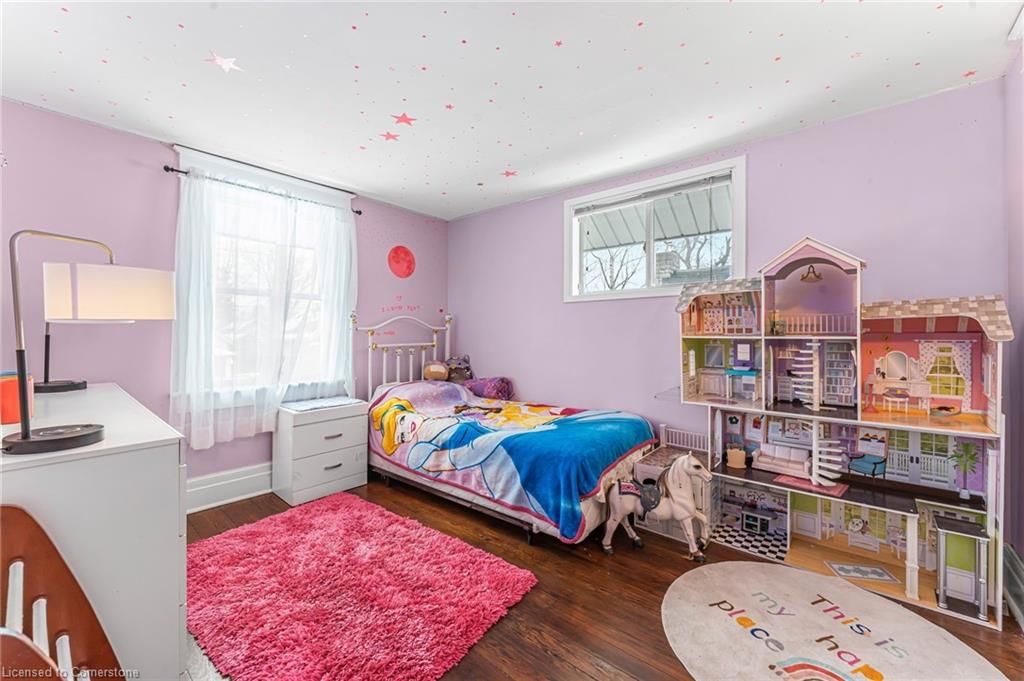
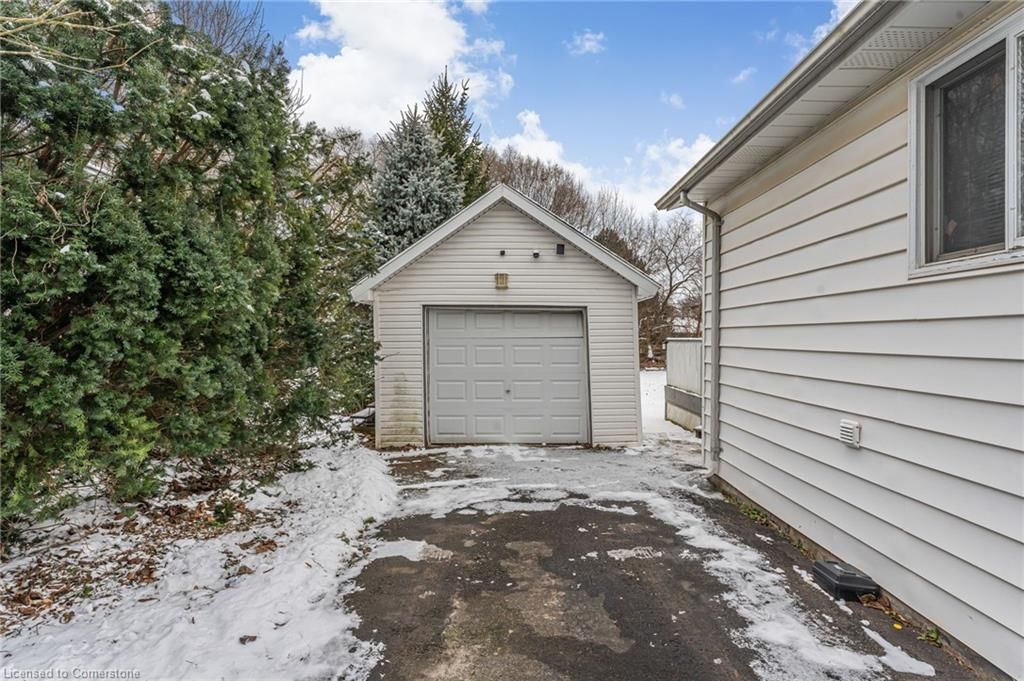
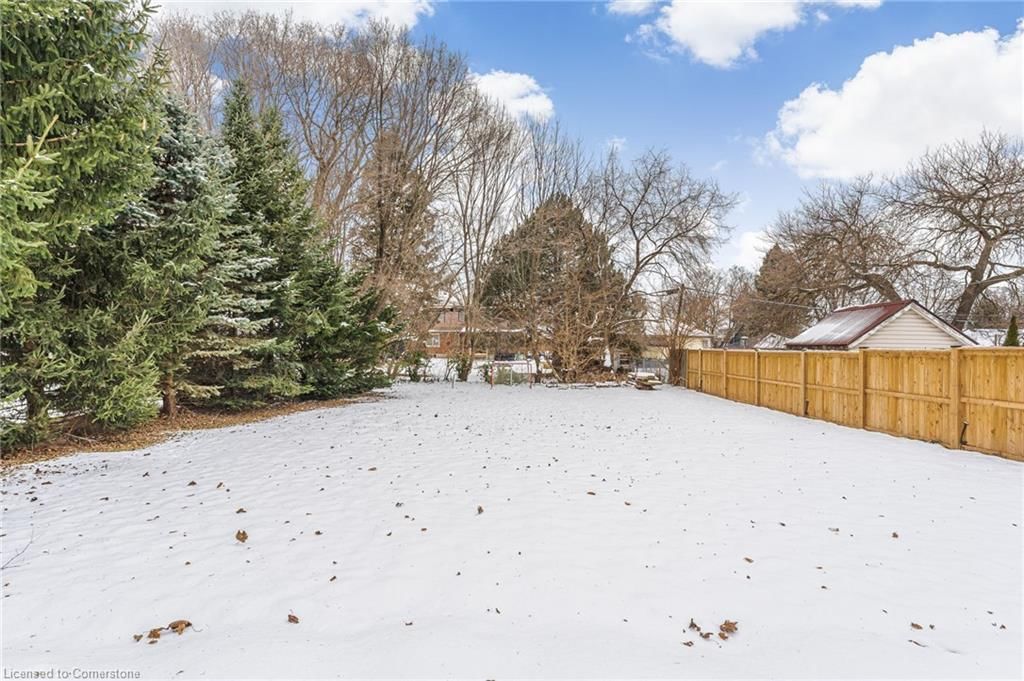
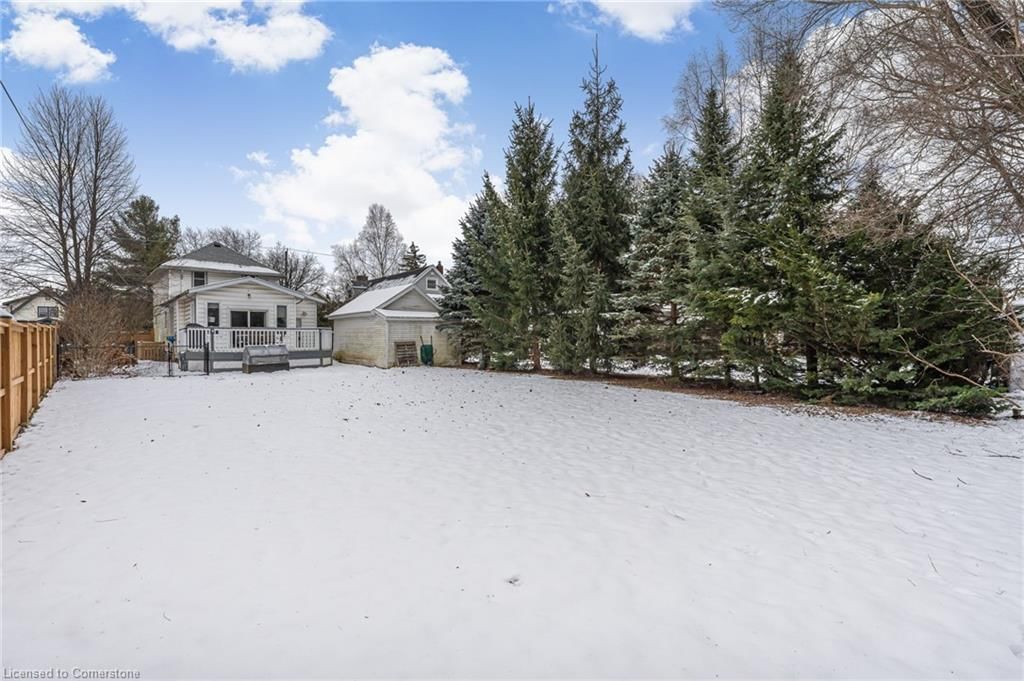
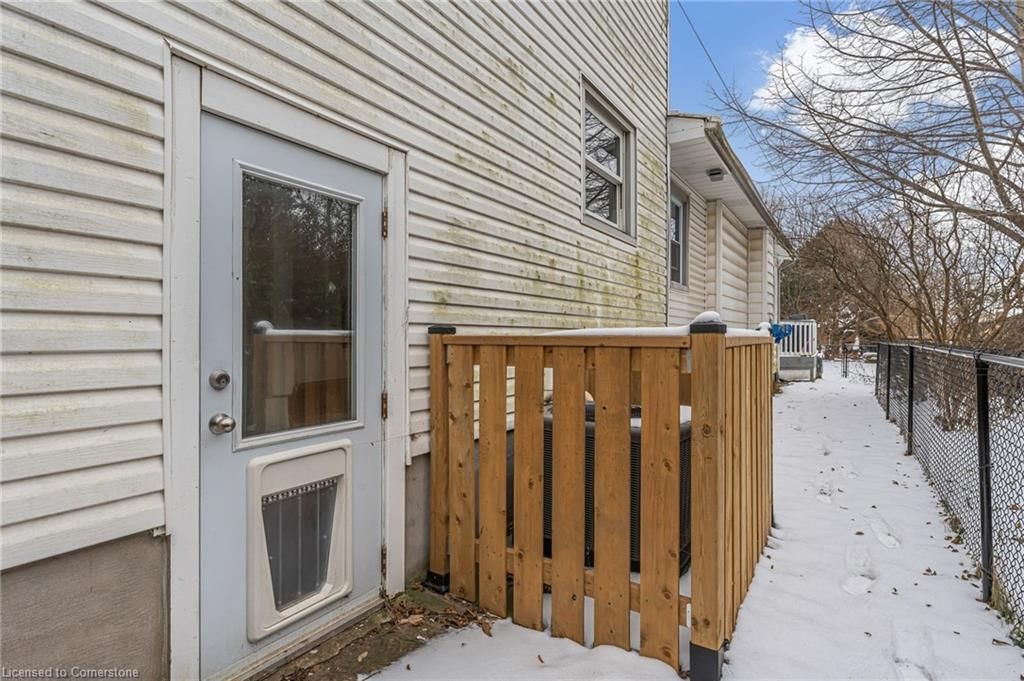
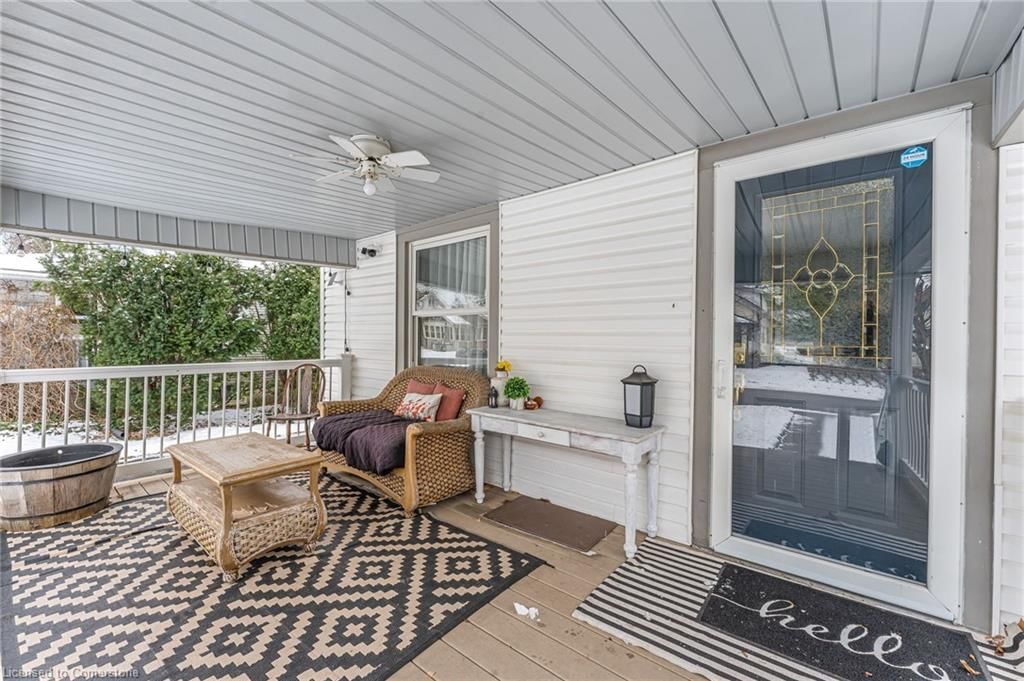
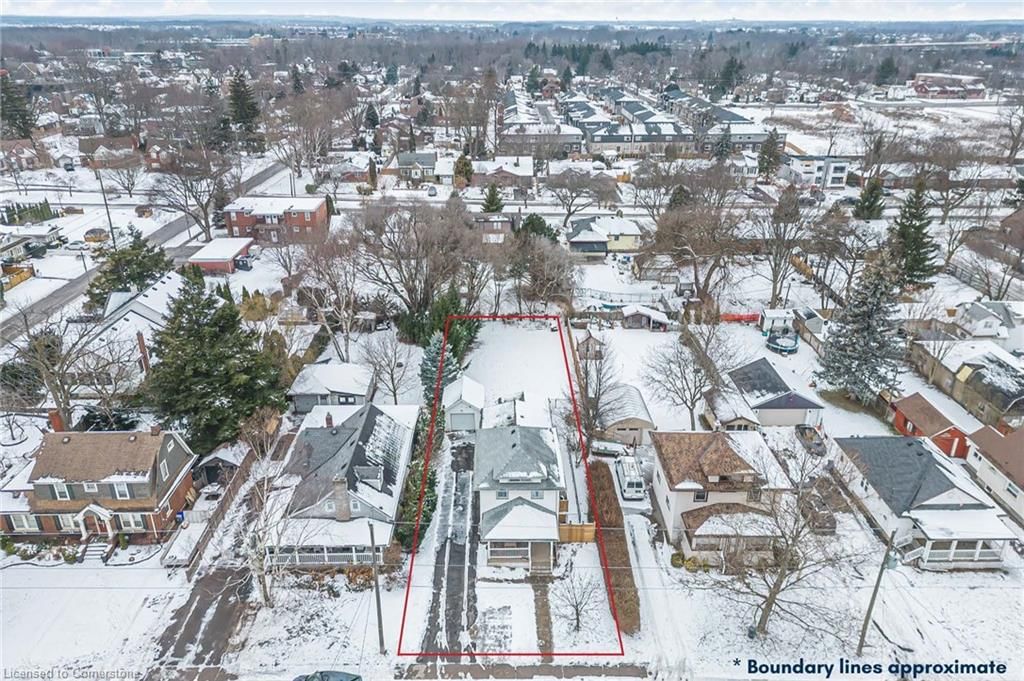
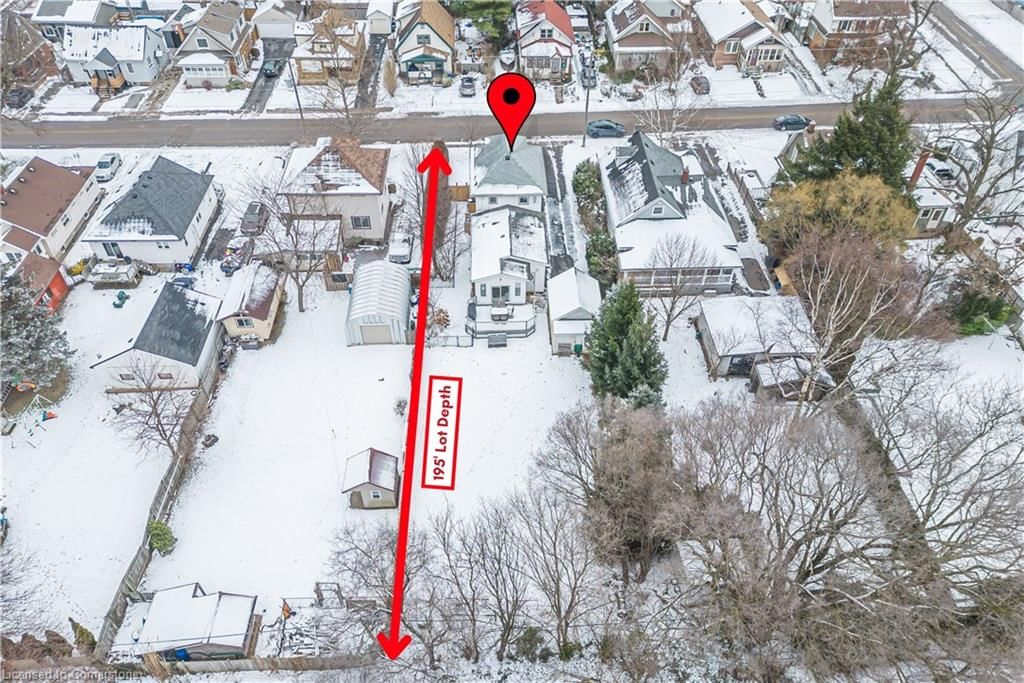
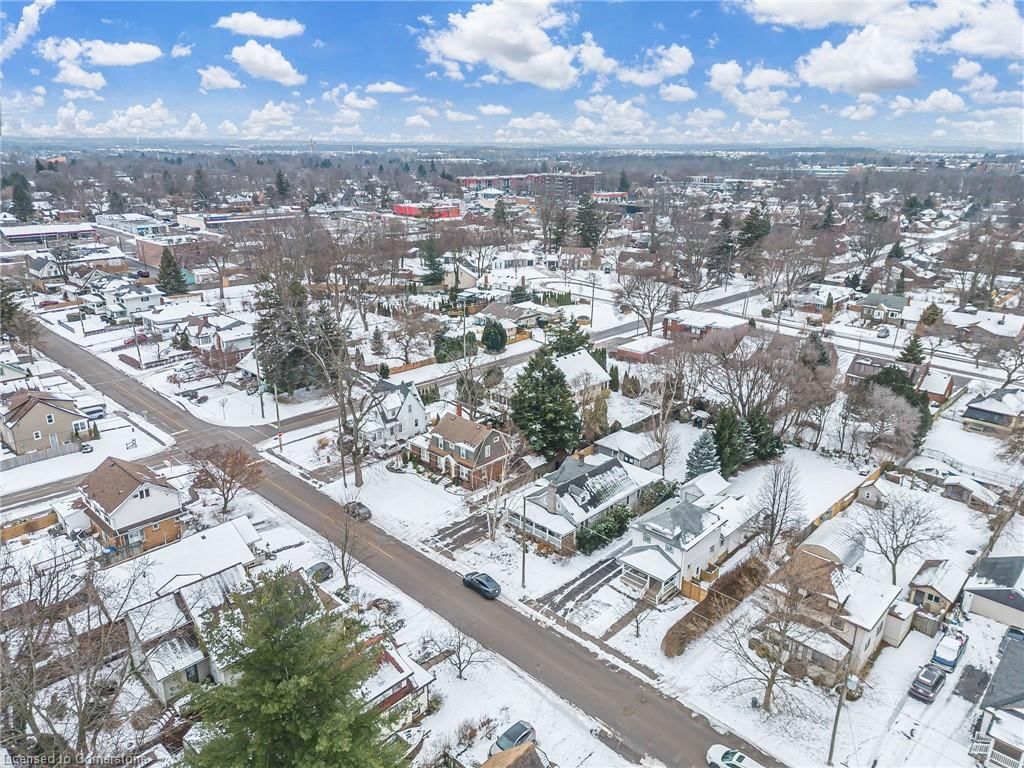
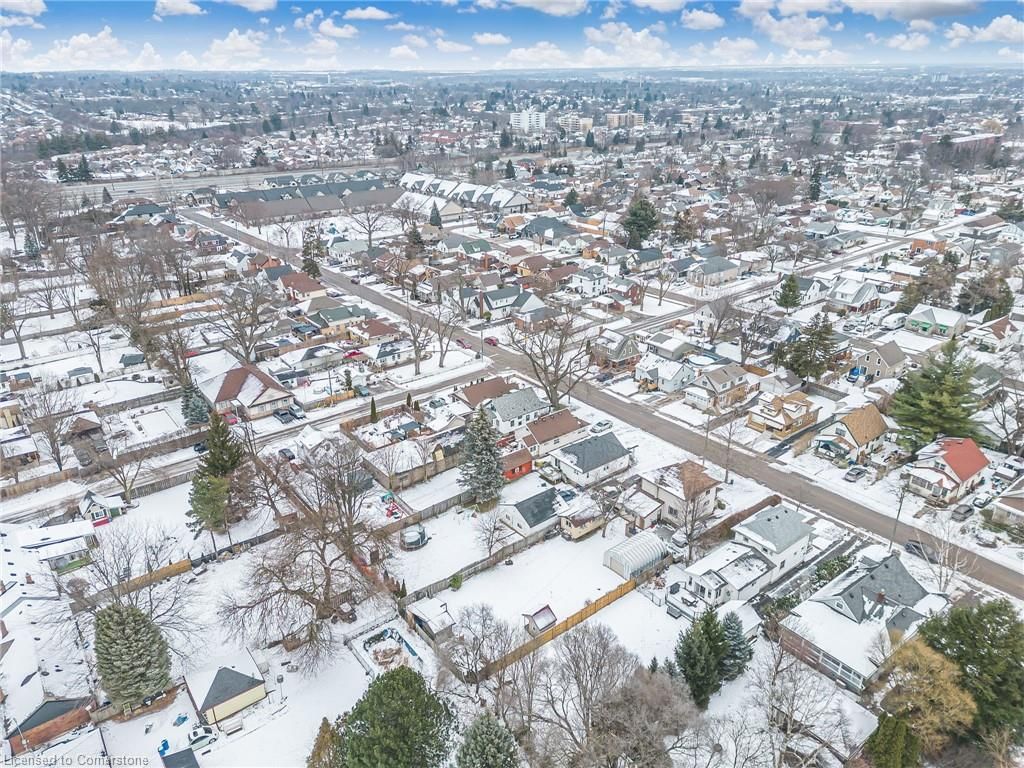
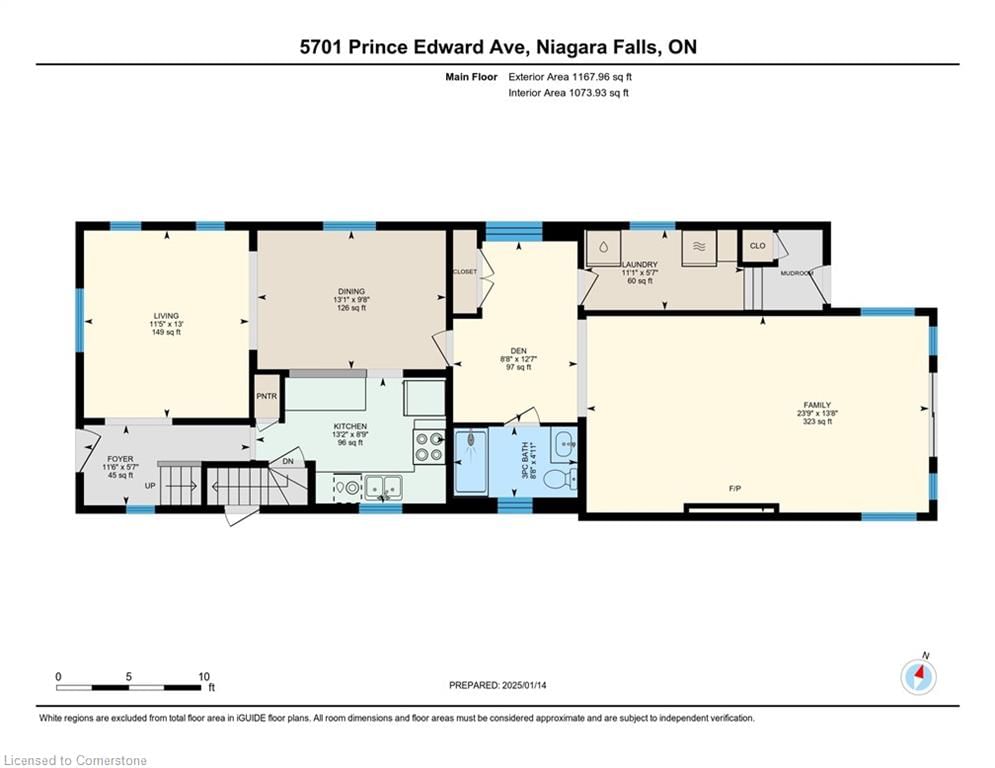
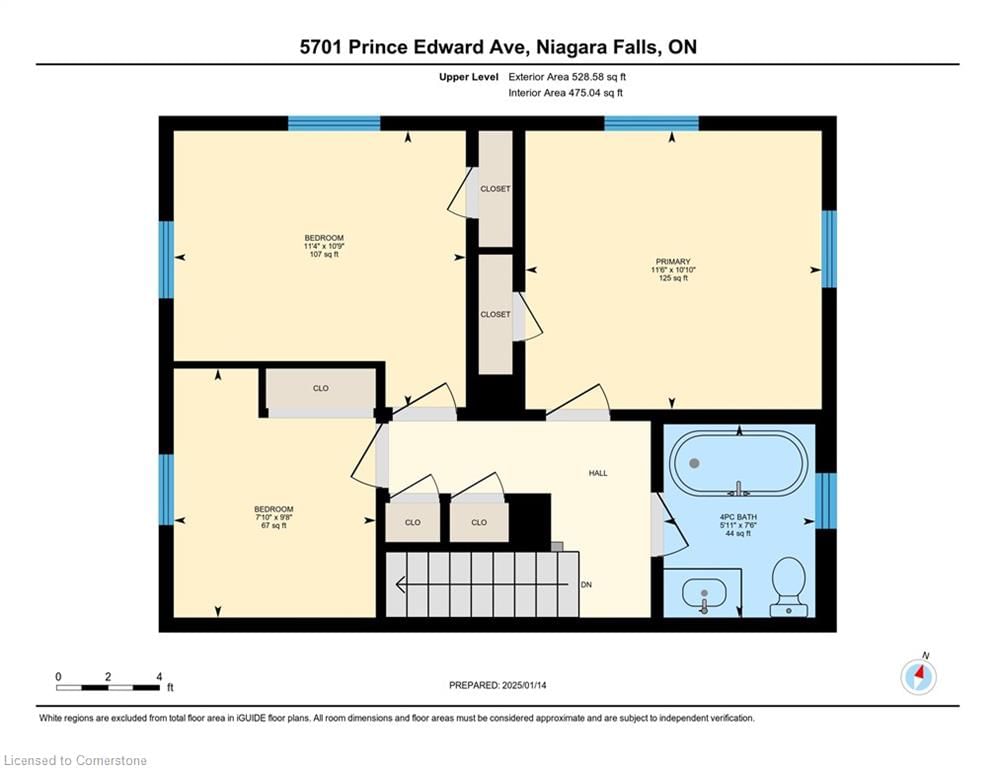
Welcome to this 2.5 storey, 3 bedroom home on a massive 53’ x 195’ lot! Located in a central neighbourhood in Niagara falls, this home has easy access to the QEW, 420 & is extremely close to all essential amenities. The foyer, living room & dining room all have maple hardwood flooring. The kitchen boasts oak hardwood cabinets, granite countertops, ceramic tile backsplash & a raised breakfast bar. At the rear of the house is a spacious family room addition that has carpet flooring, cathedral ceiling & a floor-to-ceiling stone mantle with a natural gas fireplace (not working) & a patio door to the rear deck. A 3-piece main floor bathroom has a dual flush toilet & a walk-in shower with glass doors & a ceramic tile surround. The back entrance leads to the mud/laundry room with ceramic tile flooring & storage cabinetry. A 4-piece bathroom upstairs includes a rustic clawfoot tub, decorative mirror & a vanity with a stone countertop. 3 bedrooms have oak hardwood flooring & a single closet. Attic space is accessible via a staircase & could be finished as a bonus/playroom. The beautiful backyard is a great space for play & entertainment. The detached single garage has hydro & a concrete floor. A covered front porch has a composite deck & is the perfect outdoor sitting area to relax. A fenced in side yard operates as a dog run with a doggy door in the side entrance.
Built-in Microwave,Dishwasher,Dryer,Refrigerator,Stove,Washer,Window Coverings,All Appliances Sold In "as Is" Condition
Copyright 2025 Information Technology Systems Ontario, Inc. The information provided herein must only be used by consumers that have a bona fide interest in the purchase, sale, or lease of real estate and may not be used for any commercial purpose or any other purpose.
Kitchen
Family Room
Living Room
Dining Room
Laundry
Den
Foyer
Bedroom Primary
Bedroom
Bedroom
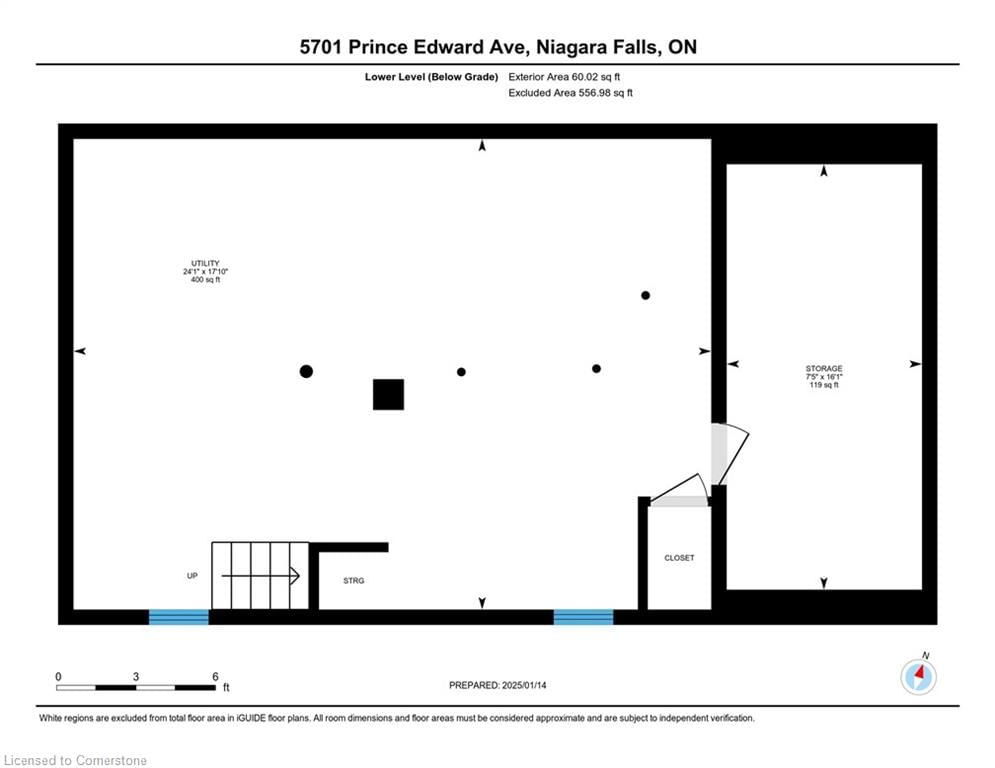
Utility Room
Storage
The graph below compares the average list price and average sale price of homes in this neighborhood by month for the last 24 months. When average sale price is greater than average list price, this may suggest a buyer's market. When average sale price is lower than the average list price this may suggest a seller's market.
The graph below illustrates the average days on market for homes in this neighborhood. The yellow area may indicate a buyer's market, the green area may indicate a balanced market and the red area may indicate a seller's market.
Sales Representative, Century 21 People’s Choice Realty Inc., Brokerage
(647) 576 - 2100